
COVID-19 = Hyperinflation
The gold and silver markets traded last week into a sideways pattern with little change. Gold closed at $1576, up about $5 in the morning session. Silver closed at $17.70. There was a flurry of buyers after the 10:30 am Pacific Standard Time close that drove the market to close at $1586.90, up about 50 cents.
With regards to some of the activity on the COMEX gold options, gold was trading in a strong market when it looked like technically it was going to take out the highs. The volume expanded to 104,354 options compared to the 37,000, which is typically the number of options traded. Most of the activity was on the October calls with the strike price of $1650 to $1750 and $1775. It has an open rising interest by about 16,100 contracts. There was also an additional 8,000 contract purchased for March. The smart money seems to be looking for a rise in the price of gold further out. The COMEX open interest took a sudden jump to 17,792; the first bullish sign since January of this year. For the past week, gold has been giving us mixed signals, trading around the weekly average price, with supply being offered into that $1580-1585 area. I am looking at a point of note that I don’t believe we have seen the economic implications of the coronavirus affecting the global economy yet. The action in the price of gold has been subdued on the upside and the downside. Considering the short open interest in the derivative markets, it was expected that the price of gold would have a deeper correction than we have seen in the past few weeks. We have seen about a $50 to $60 correction since the high at $1613 was made after the Iran missile attack on Iraq. The secondary high is in that $1598 area, which we reached on the first news that came out about the coronavirus. I was surprised that it did not follow through and instead it reverted back down below the daily, weekly and monthly mean, it made a low of $1551. We expected the low to be in that $1550-1560 area. It was in the vicinity to complete this pattern, and it reverted right back up past the daily, weekly and monthly average price.
I think the market is looking for a direction. There is still uncertainty about the global economic effect of the coronavirus, particularly in Asia and Australia. We have not yet seen any economic deterioration, at least in the government figures. If the second-largest economy is at a standstill, eliminating the ability to export commodities and products, it must affect the trading partners on a global basis. In the short term, it should have a deflationary effect. When the reality sets in that there are no supplies to replace what was exported by China, from commodities to goods and services, we are going to find ourselves with an incredible shortage on a global scale that we have never seen before. This is a potentially historic event that could be a black swan, that could shift the paradigm of supply and demand globally of all of these products related to China. The coronavirus could cause a massive global economic upheaval that will lead to a flight of capital, hyperinflation and gold and silver will rise significantly, offering incredible trading opportunities.
Based on the price of gold rising from $1551 to $1560, we now have a harmonic relationship at the $1571 level that seems to coincide with the daily, weekly and monthly average of about $1578. They appear, potentially, to be areas where you might want to cover any short positions or hedges or short derivatives. This movement may adjust the price of gold to the risks related to the coronavirus and will exacerbate some of the other economic factors that seem to be underplayed, such as the US government deficit breaking for the first time $1 trillion even as world debt levels continue to skyrocket around the world. I believe that we have very few choices and the path of least resistance is to continue to print money at levels that we have never seen before, especially if these inflationary risk triggers unfold, it could bring tremendous volatility back into the markets. Central banks will probably continue to reduce interest rates and they may have to do massive quantitative easing in different forms. I am looking for the opportunity to add my long-term view that the annual target for 2020 is $1655-1800 in gold and I don’t believe we have yet completed that initial target.
The VC PMI Monthly And Annual Targets
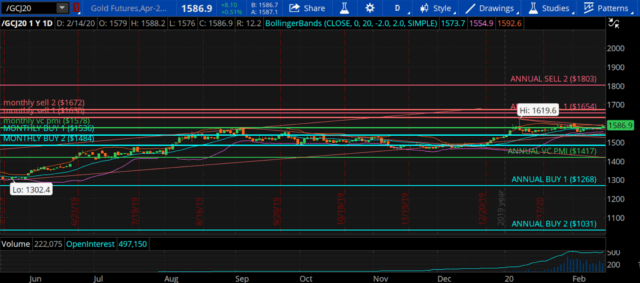
I want to review the monthly and yearly indicators that we are using to trade gold. Gold closed at $1586.90 on Friday, February 14. The monthly VC PMI is at $1578, so the market closing above that level has activated a bullish price momentum. The VC PMI average price is a 50/50 standard deviation that the market will go up or down. To use the VC PMI, we wait for the highest probability trades, either at an extreme level above or below the mean.
Courtesy: TDAmeritrade
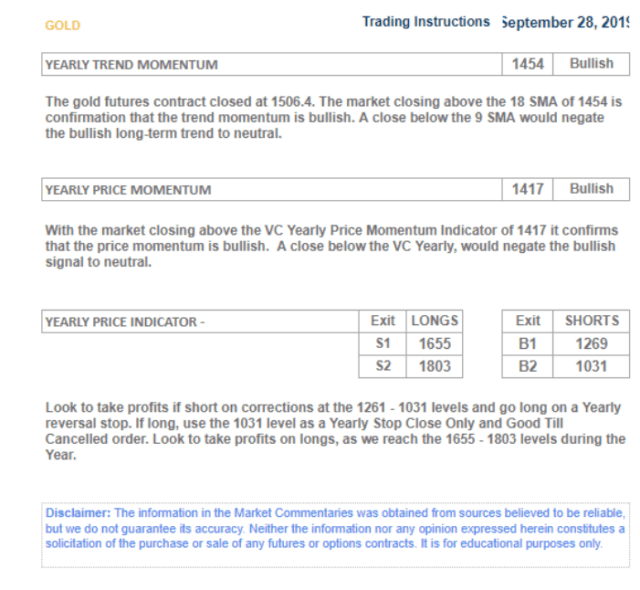
The low of this move was $1302.40 on May 30, 2019. It was not quite coming down into the annual expected buy level of $1268, which we published on September 28, 2019. The annual numbers were published to give us an idea about the structure of the market for a year starting on September 28, 2019. We use the daily, weekly and monthly indicators to identify harmonic relationships between them as the price goes to the same level for all three trends. When all three trends match, it provides the highest probability trades. It identifies when a reversion to the mean is highly likely, especially when all three trends match.
2019/2020 S&D Targets
Courtesy: ema2tradelivesignals.com
The market closing above the average monthly price of $1578 means that we are coming into the rest of this month with bullish price momentum. This activates the monthly target above the mean of $1630 (Sell 1) for the remainder of February. The Sell 1 level has a 90% probability that the market will revert from there back to the mean. If it does not activate a short signal after confirmation, the next level above, the Sell 2 level, activates a 95% probability of a reversion to the mean if it is triggered. If gold goes down to the next level below at $1578, it would neutralize the bullish price momentum to neutral. It would also activate the level below Buy 1 at $1536 on a second close below. The Buy 2 level is $1484.
We can expect that, based on the artificial intelligence of the VC PMI and gold closing above the monthly average price, it activates the Sell 1 level of $1630 to the Sell 2 level of $1672 as targets. As we come into next week and the balance of this month if gold closes below $1578, it would negate this bullishness to neutral and another close below activates the bearish price momentum with a target of the Buy 1 level of $1536 to the Buy 2 level of $1484.
On the right of the chart are the annual VC PMI numbers. Because the market closed above the annual mean price of $1418, the Sell 1 level of $1654 has been activated. The price protection for the annual indicators is a close below $1417. If it closes below $1417, it activates the annual target below the mean of the Buy 1 level of $1268 to the Buy 2 annual level of $1031.
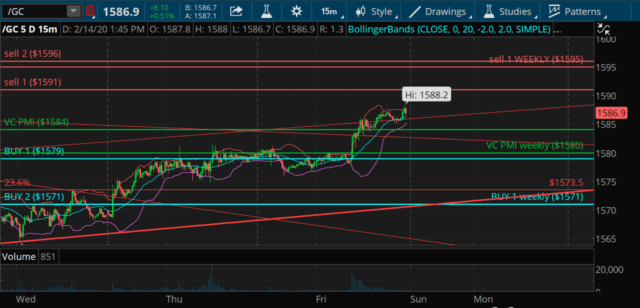
Let’s take a look at the VC PMI weekly data and see where the trigger points have been identified for next trading week.
February 14, 2020: Gold Weekly Report
Summary
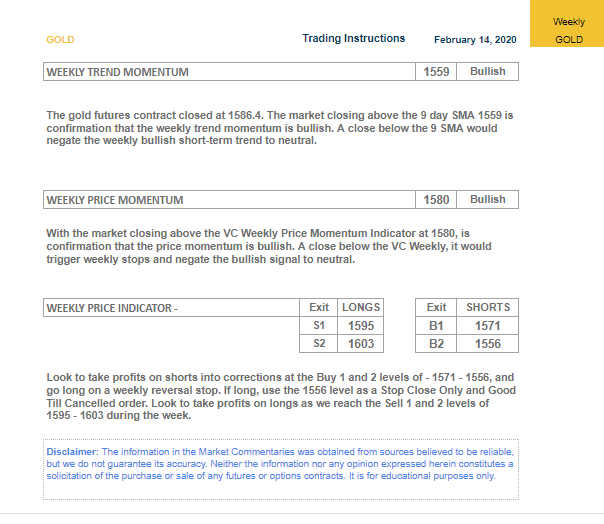
The weekly price momentum of 1559 is bullish.
The weekly VC PMI of 1580 is bullish.
A close below 1580 stop negates this bullishness neutral.
If long, cover 1595-1603 to go neutral.
Conclusion:
Based on the AI of the VC PMI, the monthly and yearly indicators are in bullish price momentum. The monthly indicator gives you a protective stop on a close below $1578, which would negate this bullishness to neutral. If the market closes below $1578, it activates the monthly targets of $1536 to $1584 below. Before I make any further interpretations, I want to see how the price reacts from where we are right now. We are in a neutral to bullish position and a close below $1578 could activate the monthly levels below $1536 to $1484. We may find more buyers to bring the price up to $1619, which was the previous target made on January 8 after the Iran missile attack on a US base in Iraq, in which case the market could reach the annual target of $1655. If we get a spike move up into this price, I strongly suggest that you lock in your profits and reduce your position or hedge, since the annual, monthly, weekly and daily targets will have been completed. The price action is the element that activates the VC PMI trigger points, which gives us a methodical, scientific way to trade the market with a very specific set of criteria.
Disclosure: I am/we are long NUGT. I wrote this article myself, and it expresses my own opinions. I am not receiving compensation for it. I have no business relationship with any company ...
more


Initially deflation then possible inflation due to scarcity. Chilling analysis. One thing I read is chilling as well. COVID-19 is 20 times easier to catch than is SARS! It is a contagion on steroids!