
Copper/Dow Ratio Signals Commodities Just Getting Started
Earlier this month, we took a brief look at Copper's historic breakout. This week, we'll look at a couple more Copper charts that suggest the commodity boom (think "inflation") is just getting started.
(Click on image to enlarge)
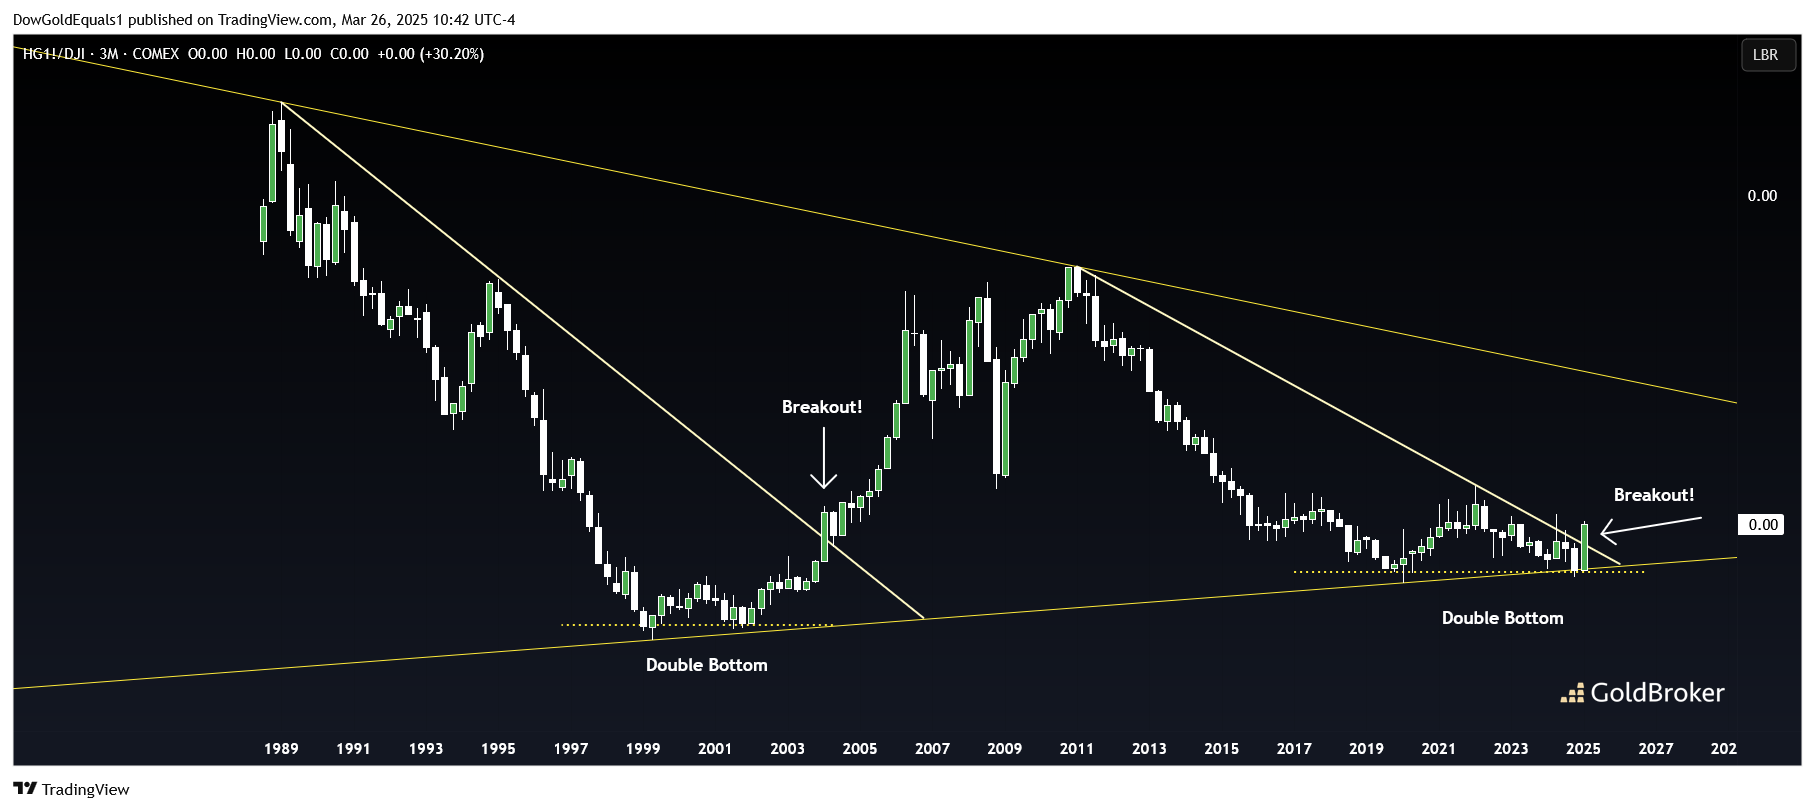
The first chart we'll look at is the ratio of Copper/Dow. When Copper is outperforming stocks, we've historically seen all commodities do very well, especially Gold and Silver. I have defined this chart as a very broad wedge, but the action inside the wedge is what's of interest. Note first the two double bottoms I've indicated - one at the turn of the century and the second forming between 2020-2024. The rise off the first double bottom sparked a huge bull market in all commodities and saw the gold price increase from just $250 to nearly $2,000! Also of interest is the recent breakout from a descending trendline. The last such significant breakout occurred back in 2004, when the commodities boom was just getting started. So while nothing is guaranteed, we have the exact same set up for a huge commodities bull run.
(Click on image to enlarge)
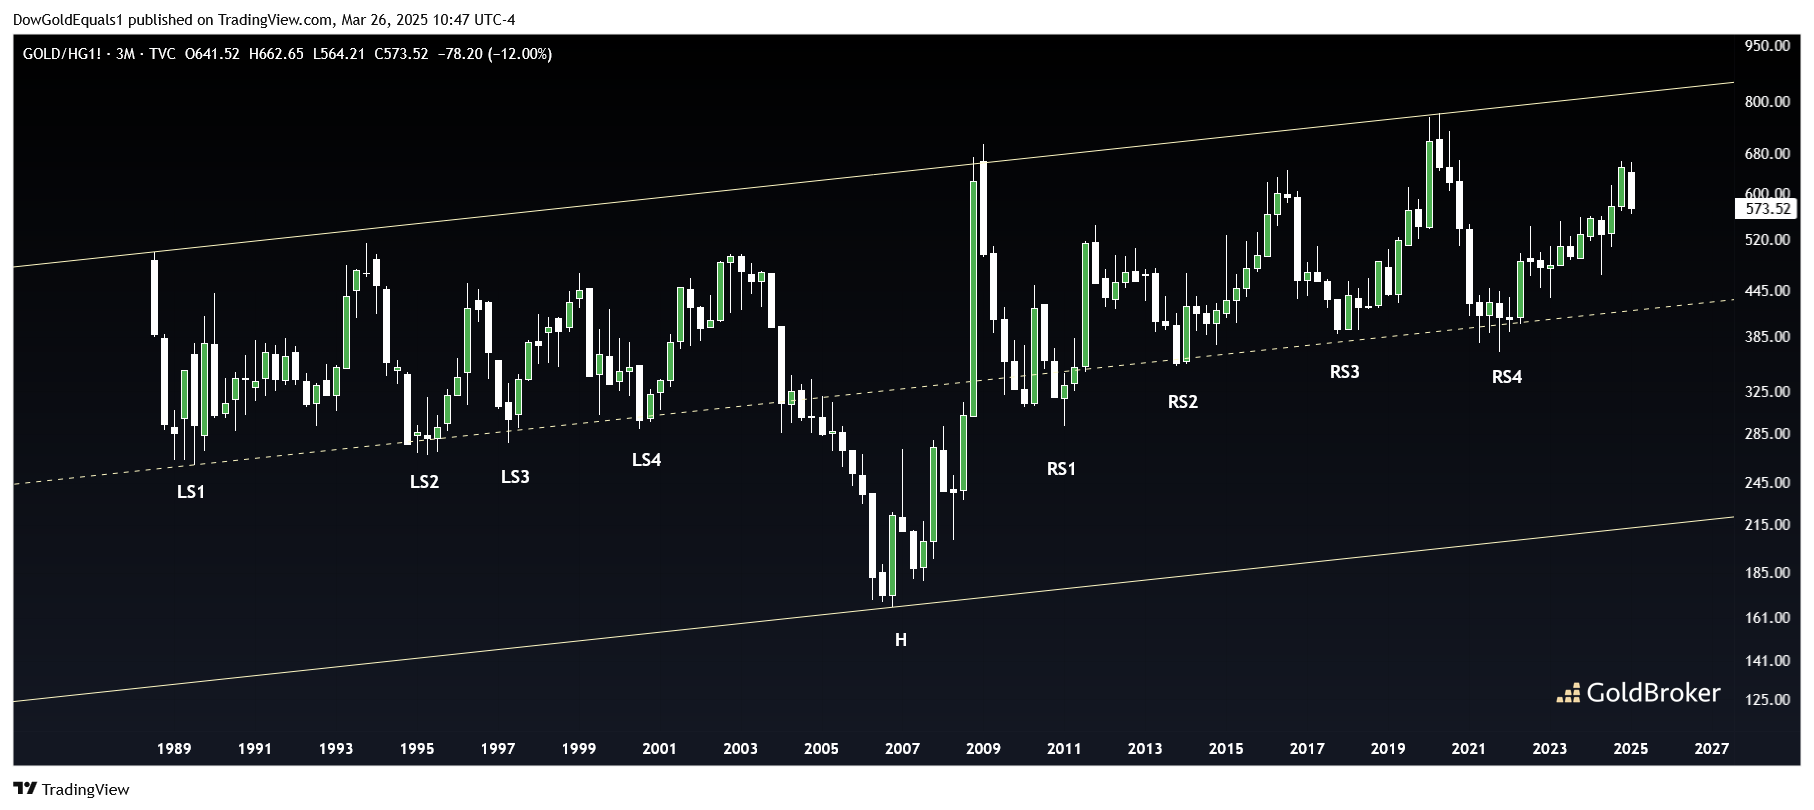
So while Copper may outperform the Dow, how will Gold do against Copper? Let's take a look! The second chart is the Gold/Copper ratio, defined as a huge ascending channel with lots of midline action. This is a chart that you have likely not seen before, but I'm depicting a potential set up for an Inverted Head & Shoulders pattern with four shoulders on each side! The skeptics will scream that an IH&S cannot possible occur over a period of years, and that multiple shoulders are just nonsense. Is it?
(Click on image to enlarge)
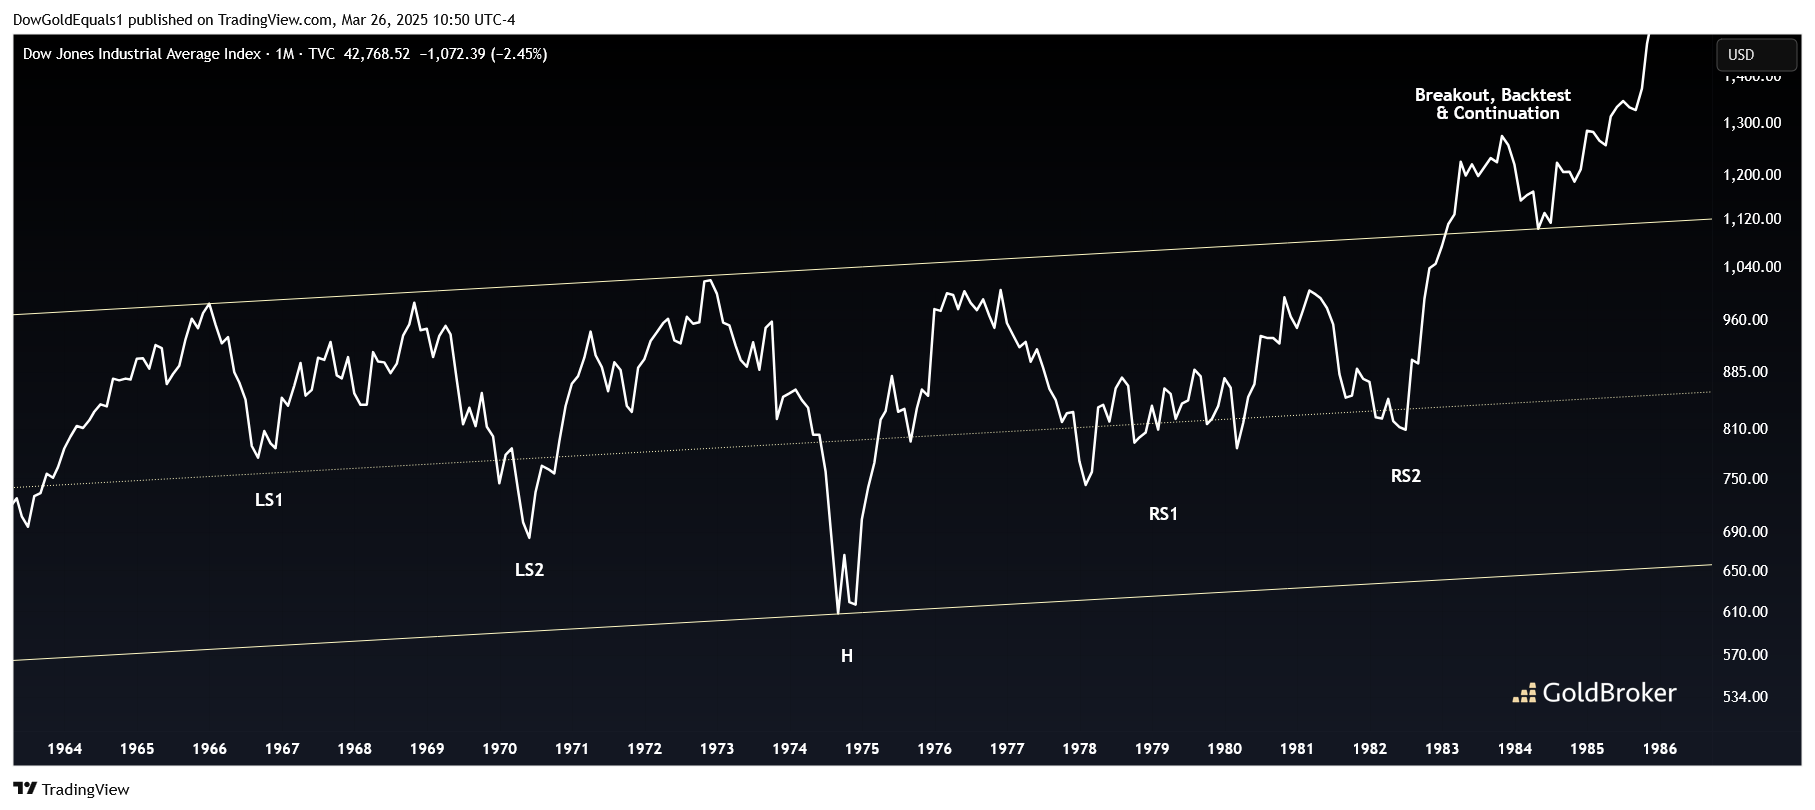
Let's take a look at a 20-year chart of the Dow during the 1960s-1980s. Same ascending channel, and same IH&S with multiple shoulders - though just two on each side. The pattern is complete with a perfect breakout, backtest and continuation. It's classic technical analysis. So can Gold/Copper repeat this pattern with a couple more shoulders thrown in? I would not count it out. And if it does, you need to remember this equation going forward: Gold > Copper > Dow.
More By This Author:
After The Gold Rush, Will We See A Silver Rush?A Policy Shift Toward Gold Accumulation Is Imminent
The Global Credit Bubble On The Verge Of Bursting
Disclosure: GoldBroker.com, all rights reserved.


