
Copper Soars After Trump Unveils Tariff Plan
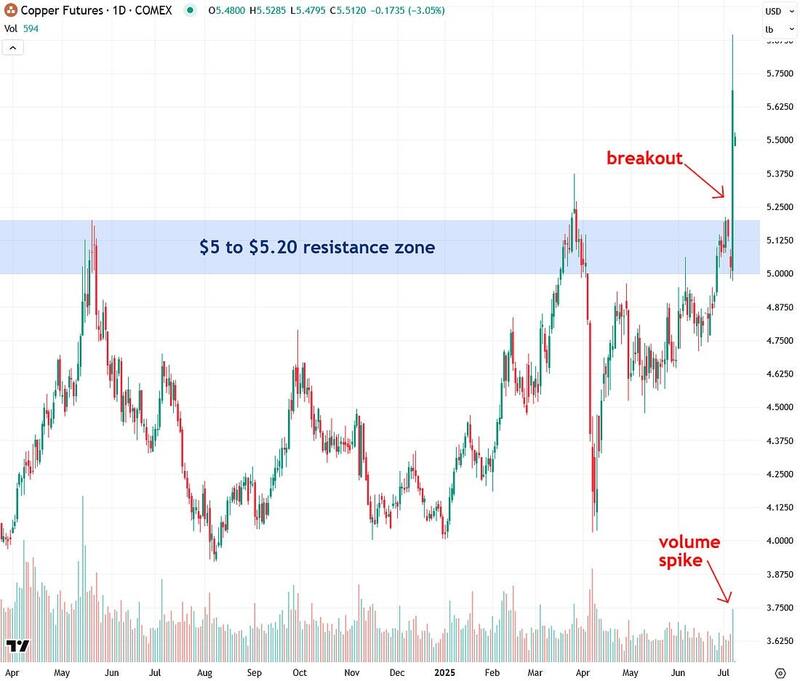
Copper’s 13% surge yesterday propelled it decisively above a critical resistance zone that has capped gains for several years, likely marking the start of a new bull market.
Longtime readers know that while my main focus in this newsletter is precious metals, I often analyze copper as well. That’s because I’m bullish on commodities overall — and copper, along with gold, plays a significant role in influencing silver prices.
After a strong run since the start of the year, yesterday we saw a dramatic turning point: President Trump announced plans for a 50% tariff on copper imports as part of a broader package of tariffs. This news sent U.S. COMEX copper futures soaring 13% to a record high, triggering the major technical breakout I’ve been anticipating.
Let’s dive into the charts to understand this move, explore what might come next, and discuss the likely implications for silver.
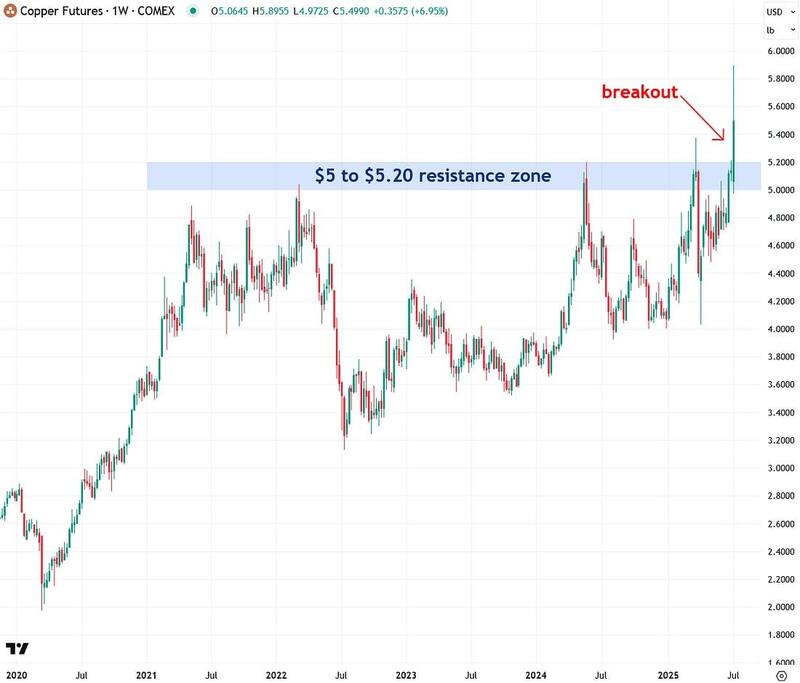
For much of the past year, I’ve highlighted the critical $5.00 to $5.20 resistance zone as the key “line in the sand” to watch — the level that would signal copper’s move into uncharted territory.
With yesterday's powerful surge, copper has decisively broken through this zone on strong volume, providing solid confirmation of the breakout. This is an extremely bullish development and a strong indication that further gains are likely ahead, as I’ll detail in this update.
The weekly chart of copper clearly illustrates the significance of the $5.00 to $5.20 resistance zone, which was defined by a series of price peaks in March 2022, May 2024, and March 2025. Yesterday's breakout has propelled copper into "blue sky" territory, marking new all-time highs.
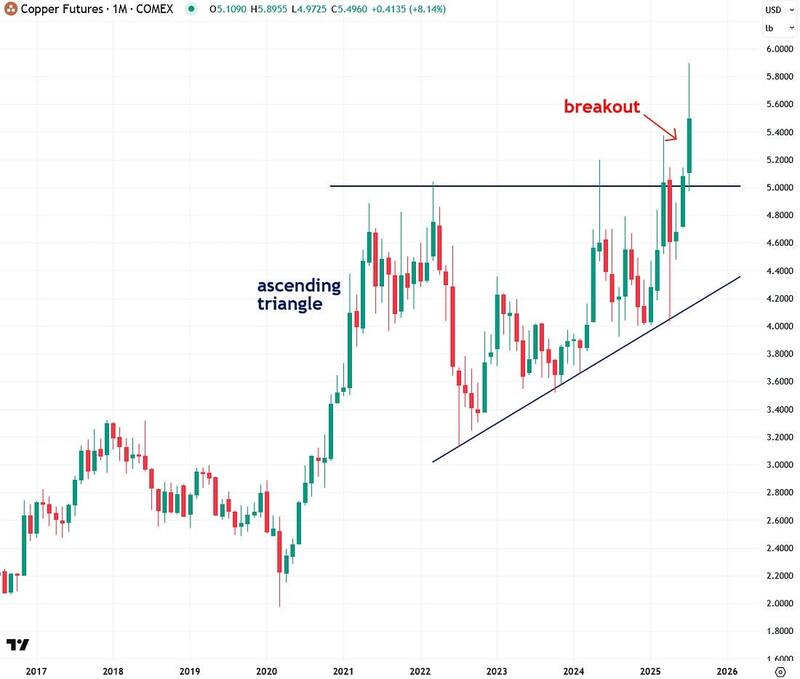
Zooming out to the long-term monthly chart, we can clearly see that copper has been forming an ascending triangle pattern over the past four years — a classic bullish formation. Yesterday's decisive breakout above that pattern signals the likely start of a new bull market, provided the move holds.
While Trump’s new tariffs were the immediate catalyst for yesterday's surge, I believe copper’s bull market was already taking shape well before this announcement.
Now that this breakout has occurred, I believe it is likely to match the strength and momentum of the powerful 2020 rally. Applying the measured move principle from technical analysis, this breakout projects an advance of $3 per pound — which would take copper to around $8, representing an impressive gain of 60% from the $5 breakout point.
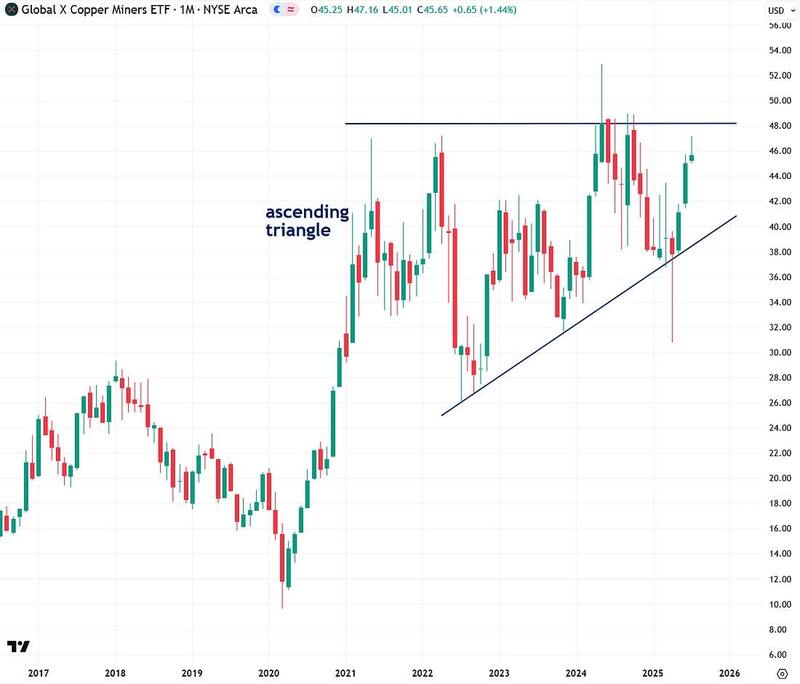
I’m also seeing a similar ascending triangle pattern forming in copper mining stocks, as highlighted by the Global X Copper Miners ETF (COPX).
With copper already broken out of its own pattern, I believe that a breakout in COPX is likely to signal a powerful upcoming bull run in copper mining stocks — a move I’m eager to take part in, as it aligns perfectly with my broader bullish outlook on commodities.
Naturally, miners with greater exposure to U.S. copper production are likely to outperform those focused primarily on non-U.S. mines due to Trump’s aggressive copper import tariff.
It’s also worth noting that copper and silver mining stocks are closely correlated, since silver is often produced as a byproduct of copper mining. That overlap means a bull market in copper miners would likely coincide with a strong rally in silver miners as well.
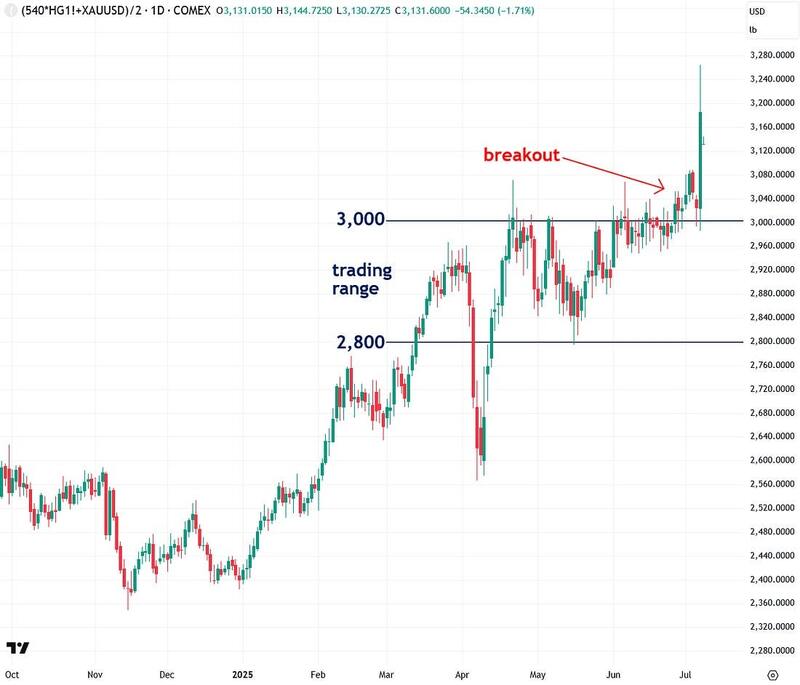
Now, let’s move on to what copper’s big surge means for silver. I often show a proprietary indicator I developed called the Synthetic Silver Price Index (SSPI), which is designed to validate silver’s price action and help filter out potential false breakouts.
The SSPI is calculated as the average of gold and copper prices, with copper scaled by a factor of 540 to prevent gold from dominating the index. Interestingly, even though silver isn’t part of the calculation, the SSPI closely tracks its movements.
Excitingly, the SSPI finally broke out of its 2,800–3,000 trading range last week, after being stuck there since March — and yesterday's 13% surge in copper prices has reinforced that breakout in a powerful way. This is a very promising sign for silver.
Historically, strong moves in both gold and copper often create a tailwind for silver, as arbitrage algorithms step in to buy it in sympathy. The decisive move in the SSPI was one of the key signals I had been watching to confirm that silver’s recent breakout is genuine.
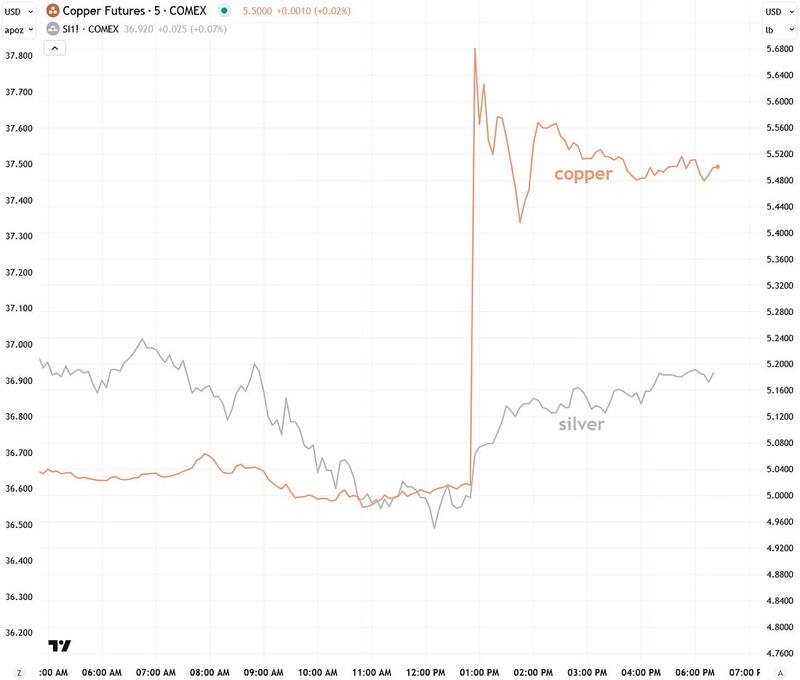
I often emphasize the importance of watching copper prices — not just gold — to gain a clearer picture of silver’s behavior. In my experience, many significant moves in silver can’t be explained by gold alone, and copper often serves as the missing piece of the puzzle.
Yesterday's price action in silver is yet another example: it started the day weak, down as much as 1.3%, but quickly reversed course and recovered most of its losses once copper began to surge. You can see this clearly in the intraday chart below.
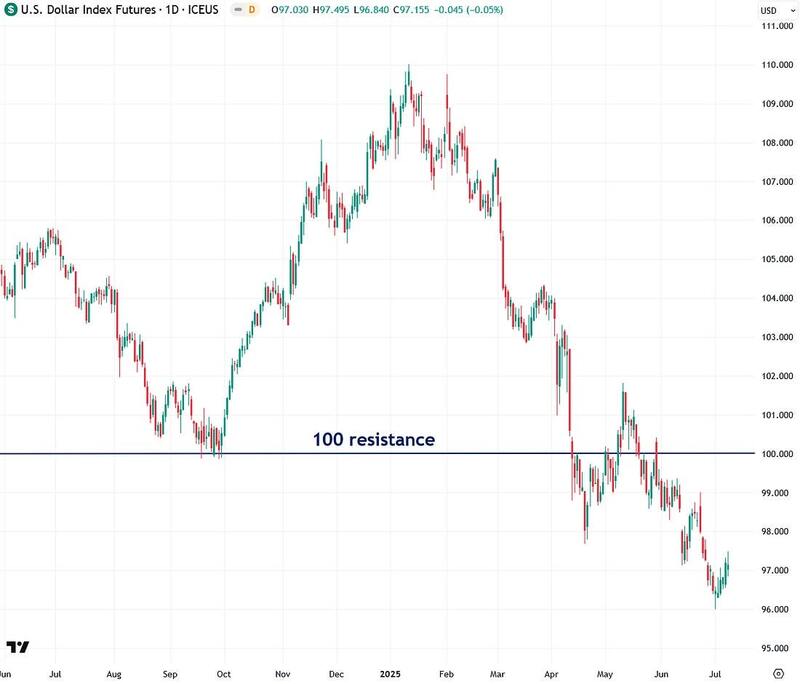
Another tailwind likely to continue driving copper — as well as silver and gold — higher is the recent breakdown of the U.S. Dollar Index below the critical 100 support level.
This decisive move has triggered a bearish confirmation signal for the dollar, which is bullish for commodities given their strong inverse relationship.
To summarize, I’ve been bullish on copper for both fundamental and technical reasons, and yesterday's surge — driven by President Trump’s tariff announcement — is just one piece of the larger puzzle.
This explosive move has confirmed the breakout and pushed copper into blue-sky territory, suggesting further gains ahead. This aligns perfectly with my broader bullish outlook on commodities.
Additionally, because copper strongly influences silver, we can expect continued upward pressure on silver, which recently broke out to 13-year highs. It’s an incredibly exciting time to be a commodities investor. As always, I’ll keep you updated as this story unfolds.
More By This Author:
A Key Pattern Is Forming In SilverGold Priced In Major Currencies Reveals Clear Consolidation
Platinum Surges Past Another Hurdle In Relentless Rally
For the author's full disclosure policy, click here.


