
Copper Is Forming A Bullish Running Triangle Pattern
Today we will talk about copper, its price action from a technical point of view, and wave structure from the Elliott wave perspective.
Copper is trading sideways since May 2021 and we see it trapped in consolidation, ideally within a bullish running triangle pattern in wave (4).
(Click on image to enlarge)
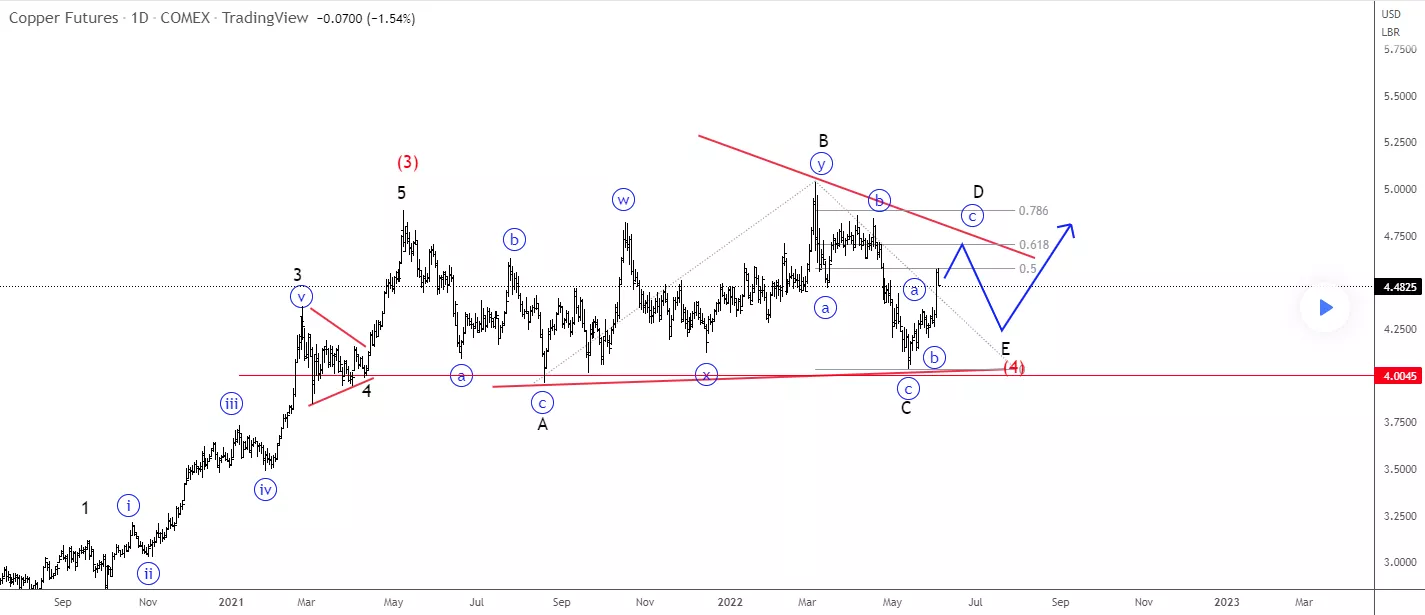
Well, looking at the daily chart of copper, seems like it has completed Elliott wave three-wave a-b-c decline for wave C. It’s already trading now in final stages of “c” of wave D, so final leg E yet to come before rally back to highs for wave (5)?
Technically speaking, we see intraday resistance for wave D around 4.6 – 4.8 area, from where we may see final wave E slow down back to 4.3 – 4.1 support zone.
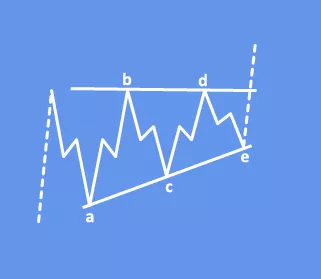
Triangles are overlapping five wave affairs A-B-C-D-E that subdivide 3-3-3-3-3 as an a-b-c. They appear to reflect a balance of forces, causing a sideways movement that is usually associated with decreasing volume and volatility. Triangles fall into four main categories i.e. ascending, descending, contracting, expanding. It is quite common, particularly in contracting triangles, for wave b to exceed the start of wave a in what may be termed a running triangle.
Triangles, by far, most commonly occur as fourth waves. Triangles are very tricky and confusing. One must study the pattern very carefully prior to taking action. Prices tend to shoot out of the triangle formation in a swift thrust. When triangles occur in the fourth wave, the market thrusts out of the triangle in the same direction as Wave 3.
Disclosure: Please be informed that information we provide is NOT a trading recommendation or investment advice. All of our work is for educational purposes only.


