Comex Update: September Gold Delivery Volume Blasts Higher
Image Source: Unsplash
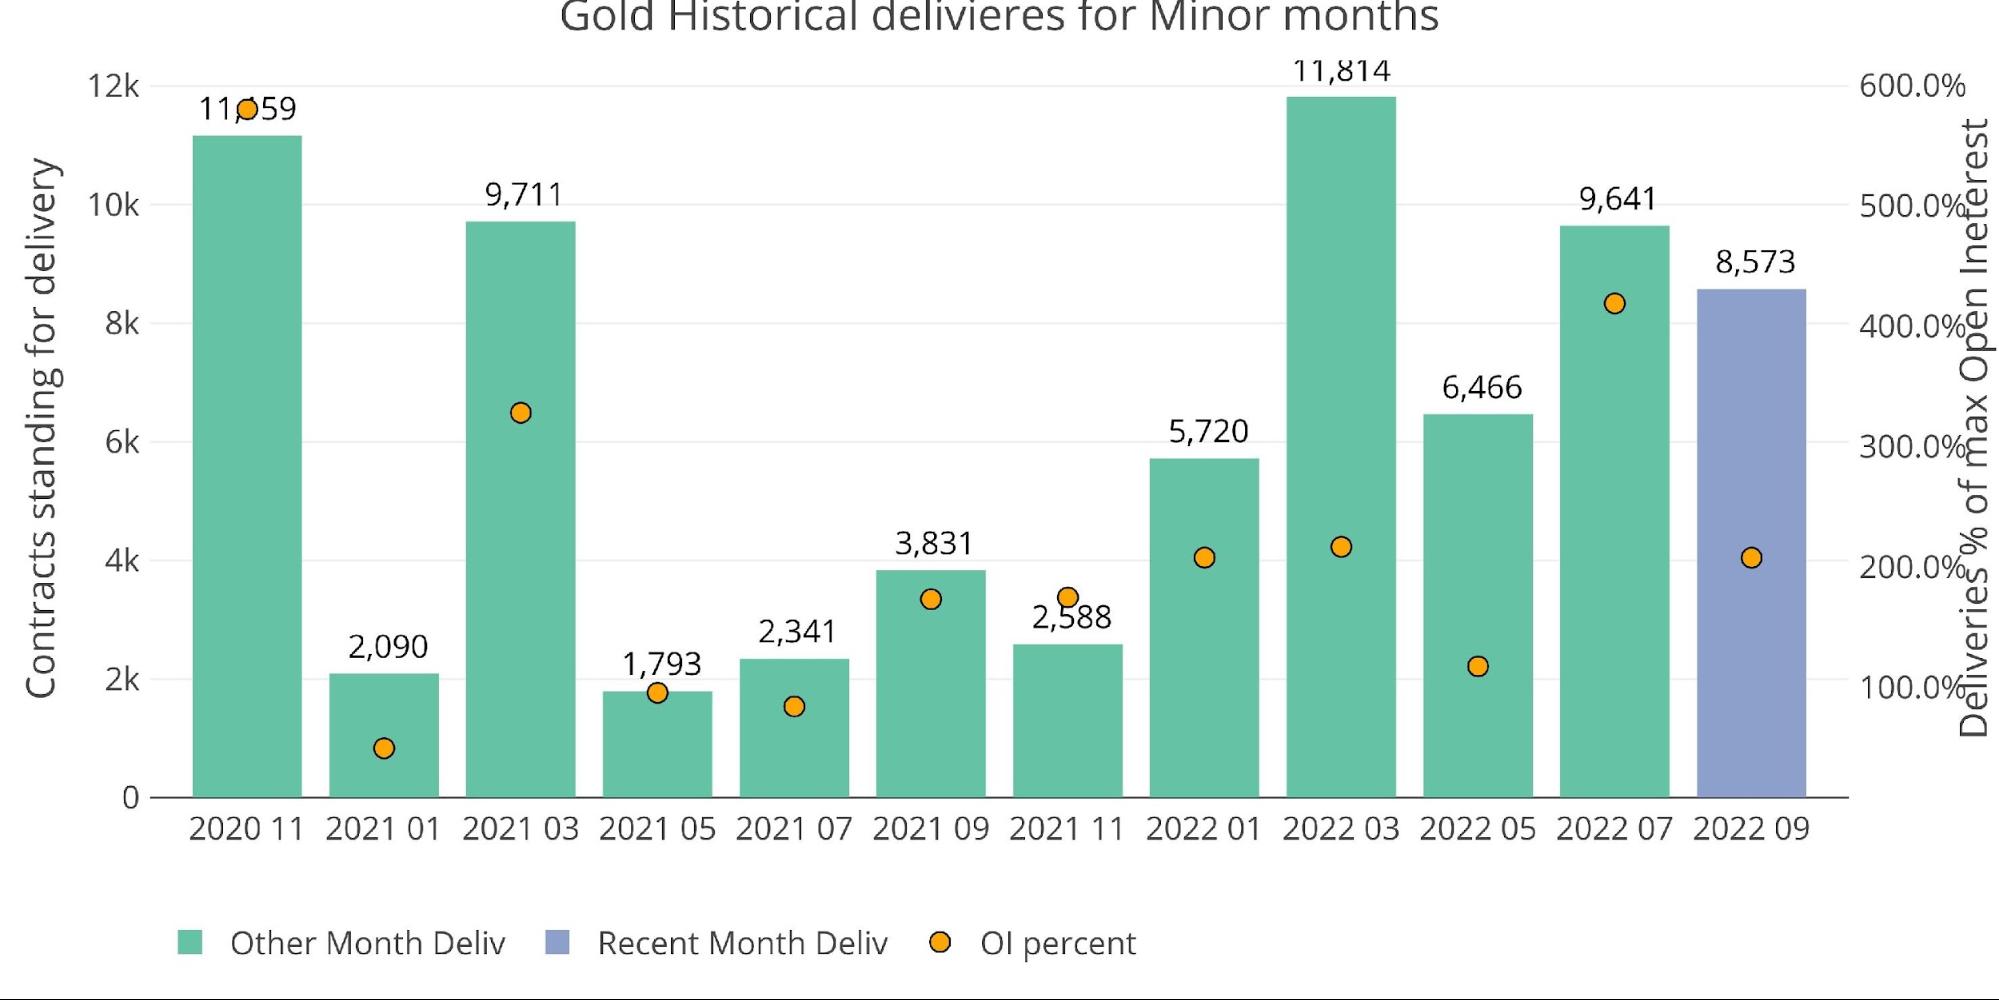
September gold has been a very strong delivery month with 8,573 contracts being delivered plus an additional 718 in open interest that will be delivered over the next week (9,219 total). It is currently still below the July month but could exceed the total by the time the month completes due to mid-month activity.
Figure: 1 Recent like-month delivery volume
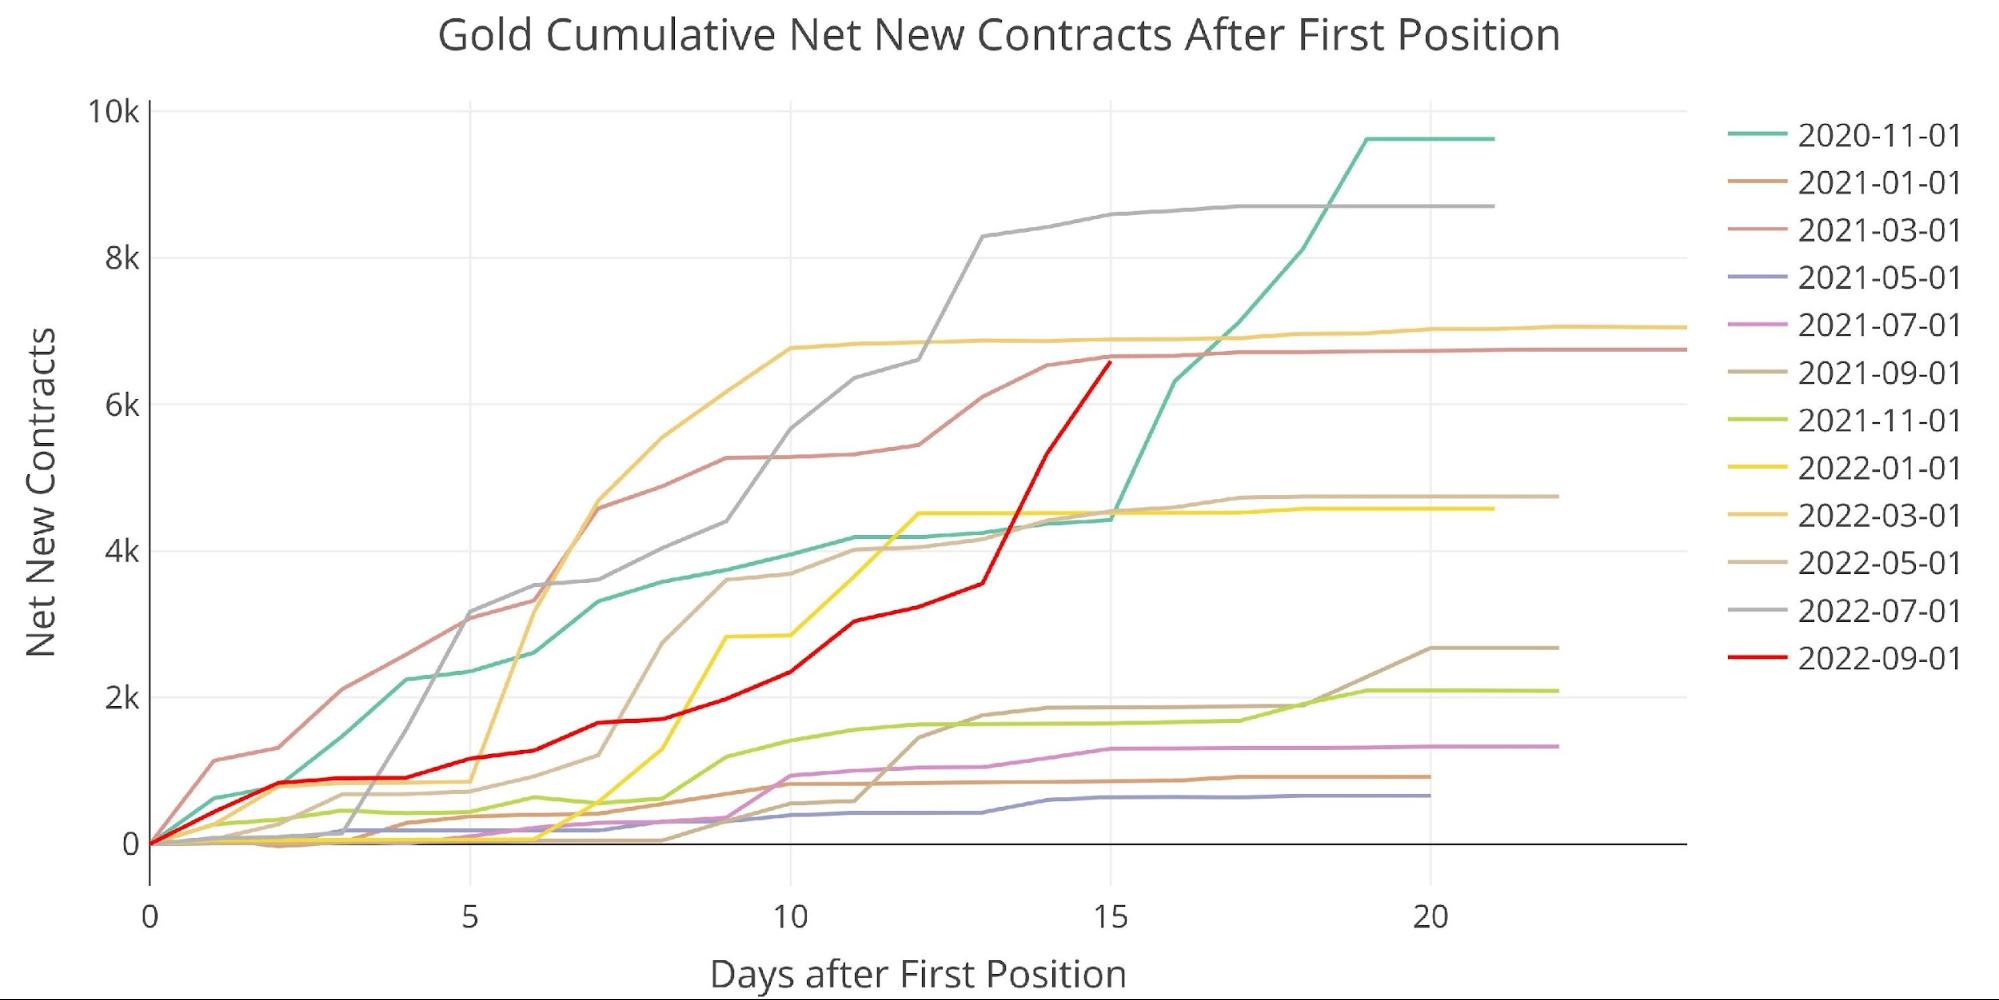
As shown below, mid-month activity has been a huge driver this month, especially recently. July has seen 6,590 such contracts, up from 3,556 only two days ago. This is a major move higher for this late in the contract!
Figure: 2 Cumulative Net New Contracts
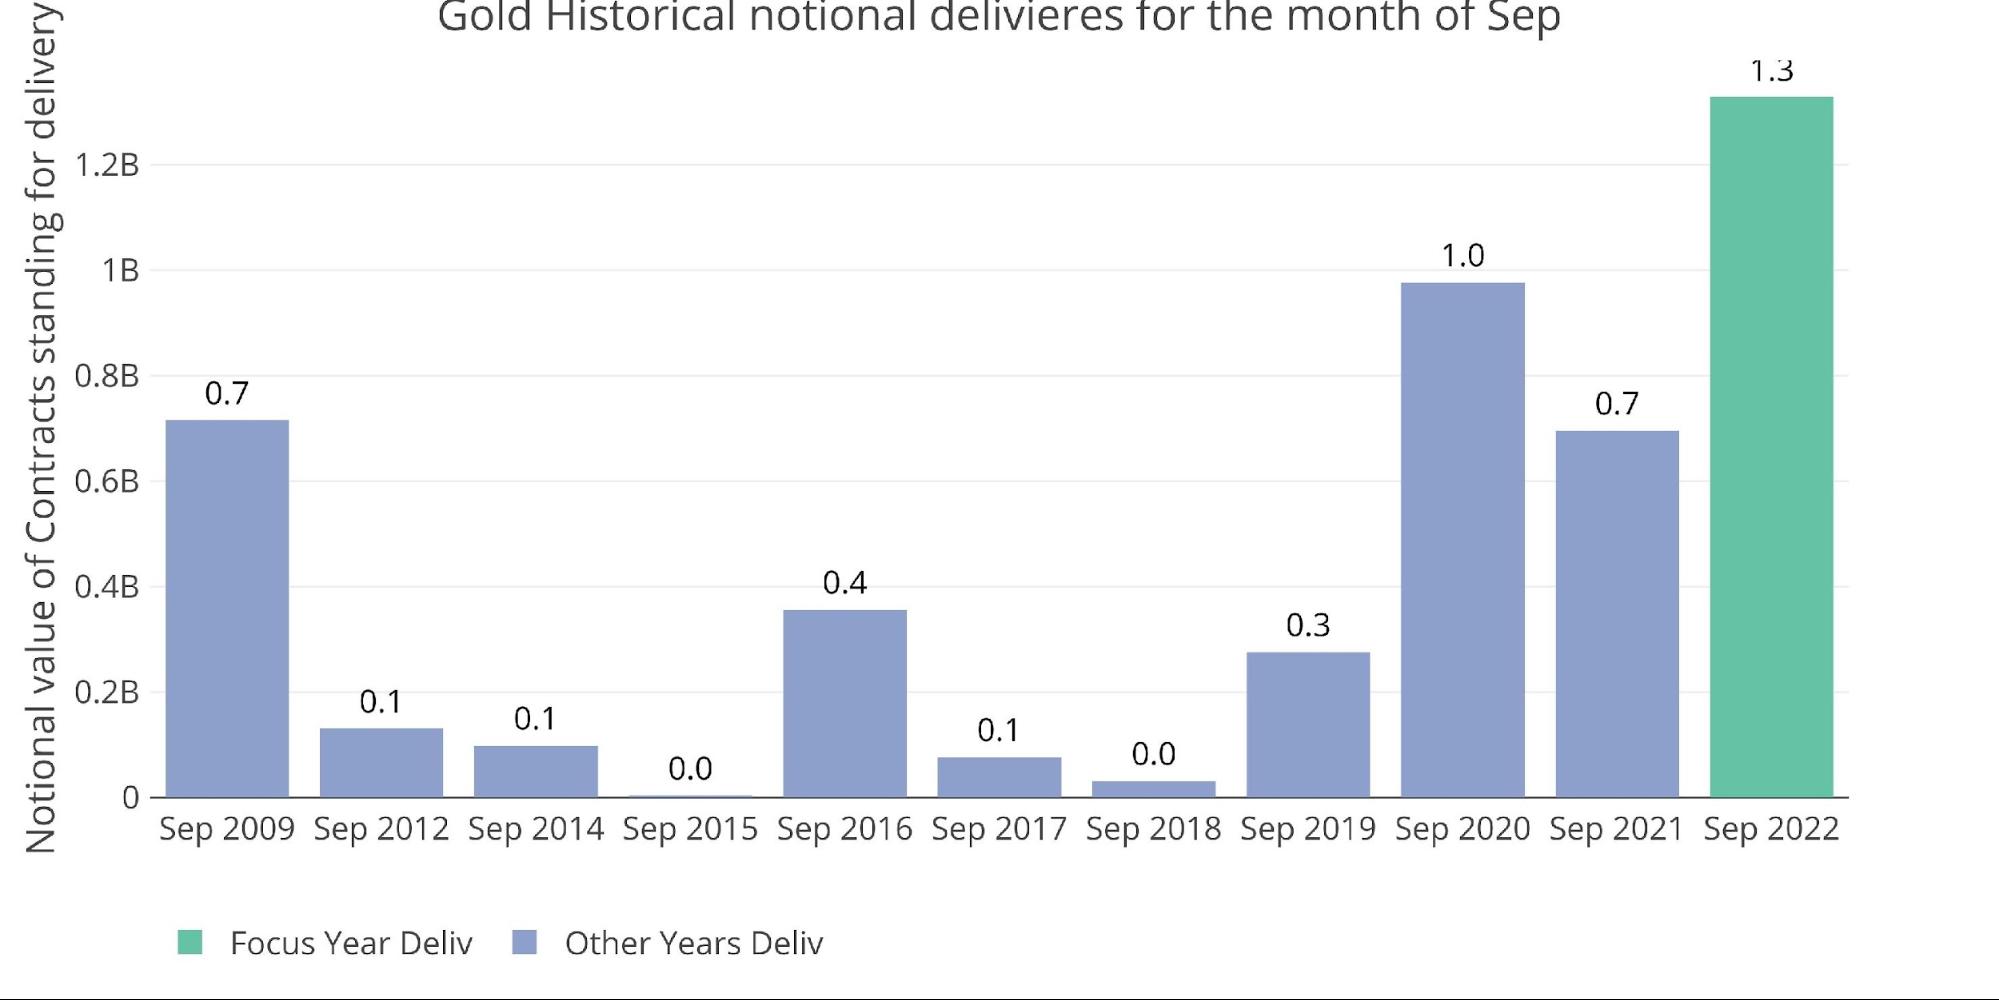
From a dollar volume perspective, this September has smashed the old record from 2020 despite the gold price is almost $400 lower!
Figure: 3 Notional Deliveries
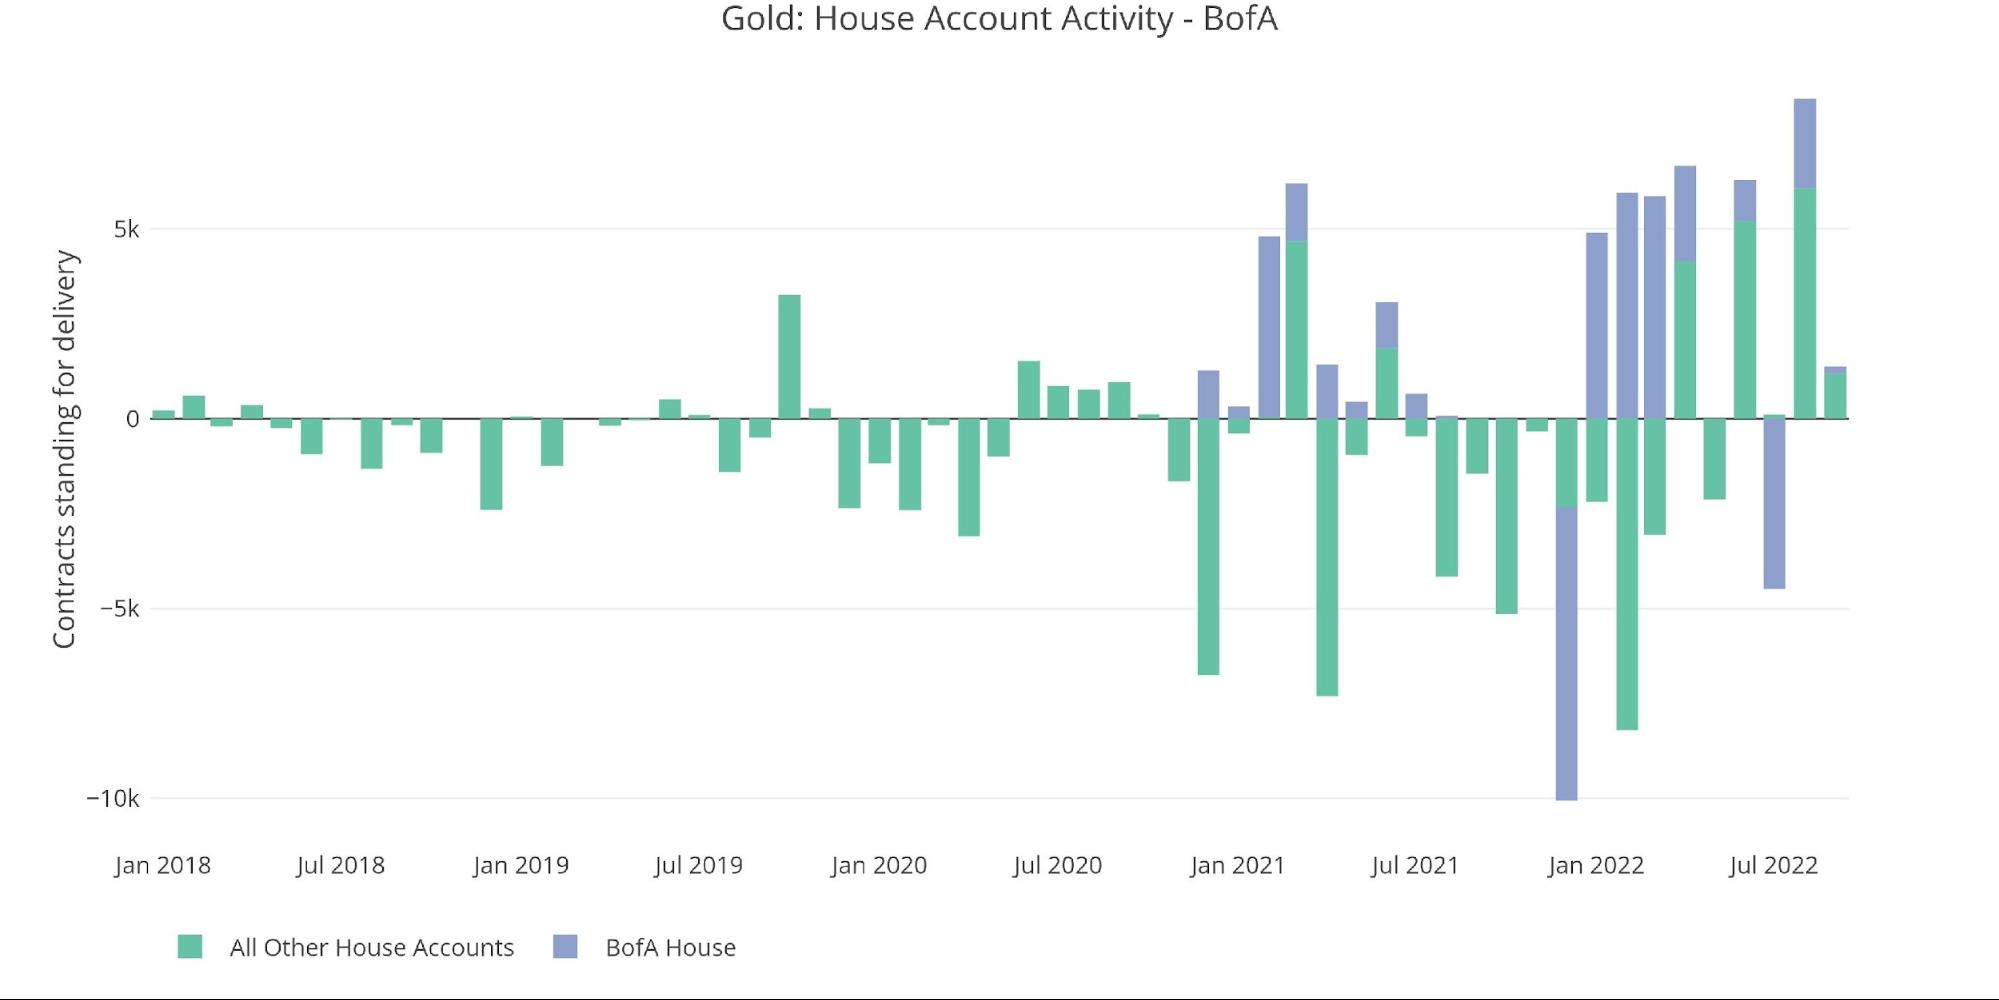
Surprisingly, the house accounts, and particularly BofA, have been extremely quiet this month. If the current numbers hold, this will be the lowest net activity from house accounts since November 2021.
Figure: 4 House Account Activity
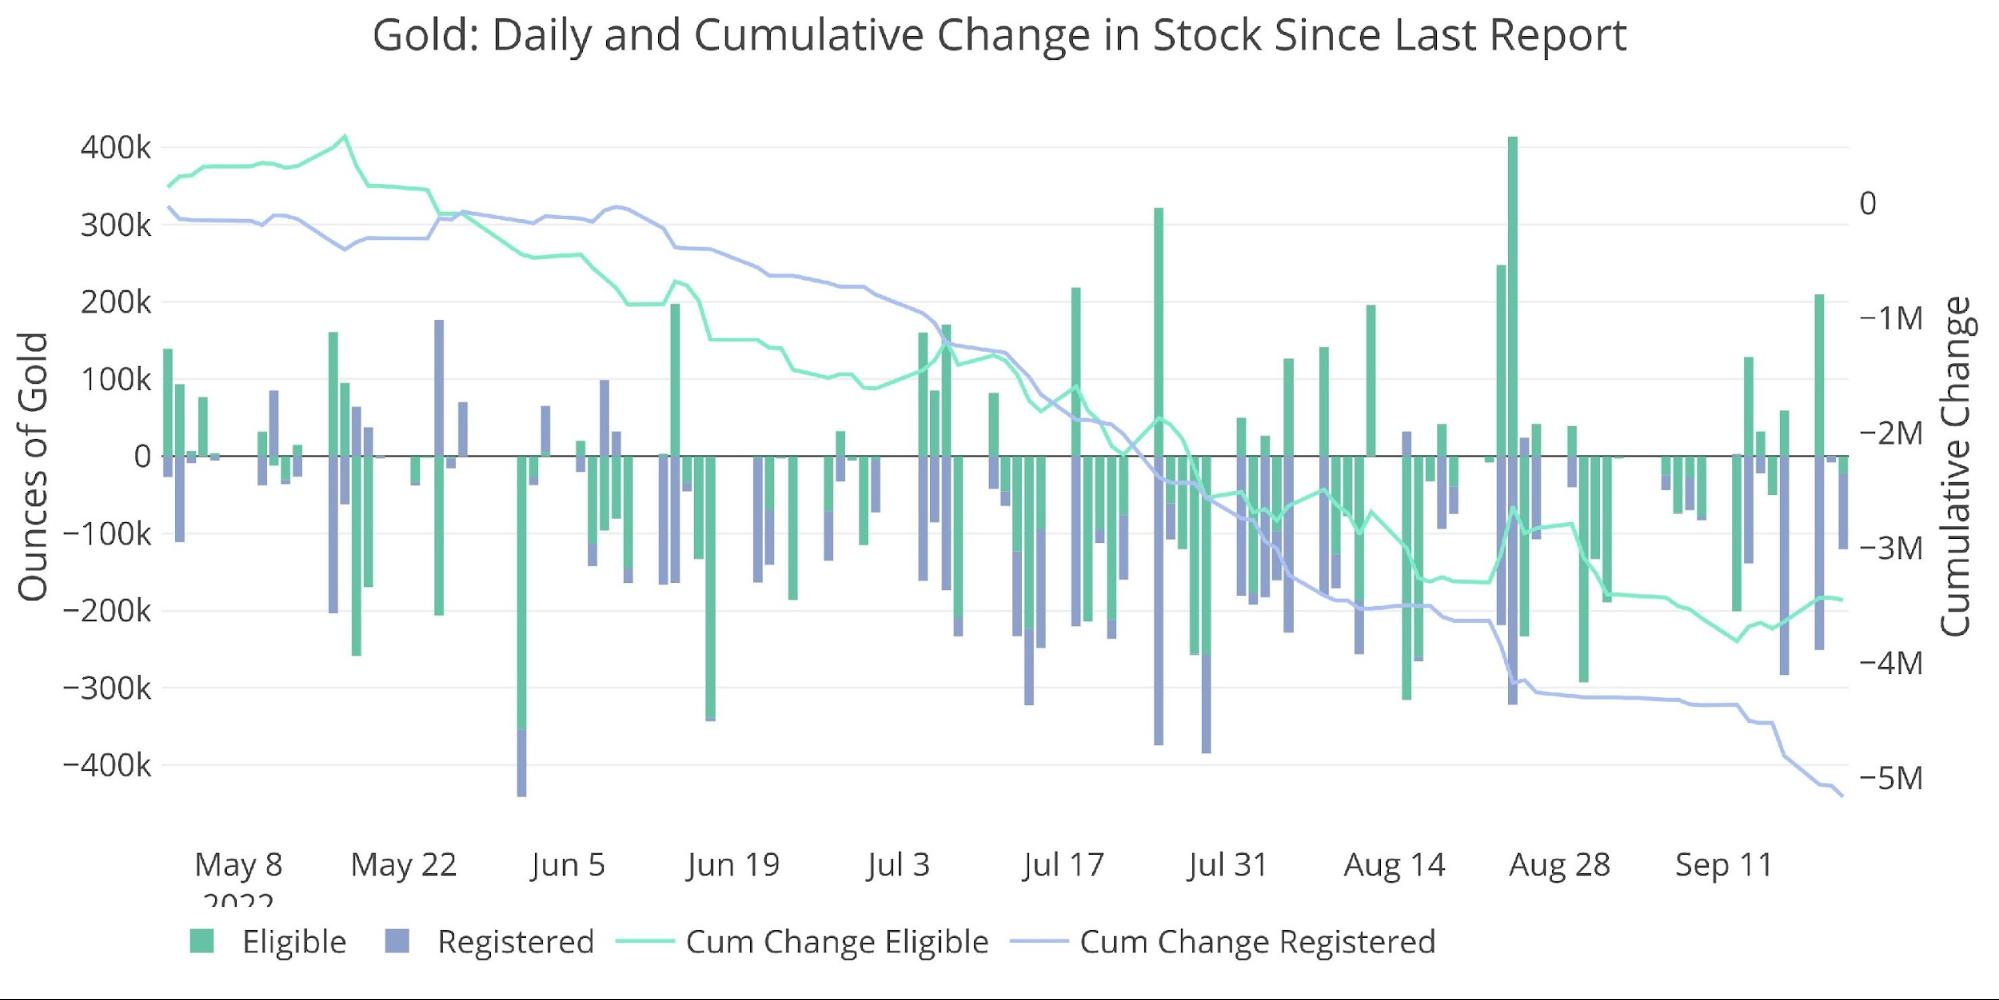
As the recent stock report showed, the physical movement of metal has been anything but quiet. Gold inventory continues to plummet at a rapid pace, with Registered dropping by a whopping 5.1M ounces since May 1st.
Figure: 5 Recent Monthly Stock Change
Gold: Next Delivery Month
Jumping ahead to October shows a slight elevation in open interest contracts relative to last year. October is an odd month as it sits between August and December. It’s too large to be a minor month, but also much smaller than major months.
As the chart below shows, with 6 days to go, the current October is above last October by 11k contracts. In fact, going back to 2007, this October shows the second highest open interest behind only 2020. The contract will start to roll in the next few days, but it’s looking promising as of now.
Figure: 6 Open Interest Countdown
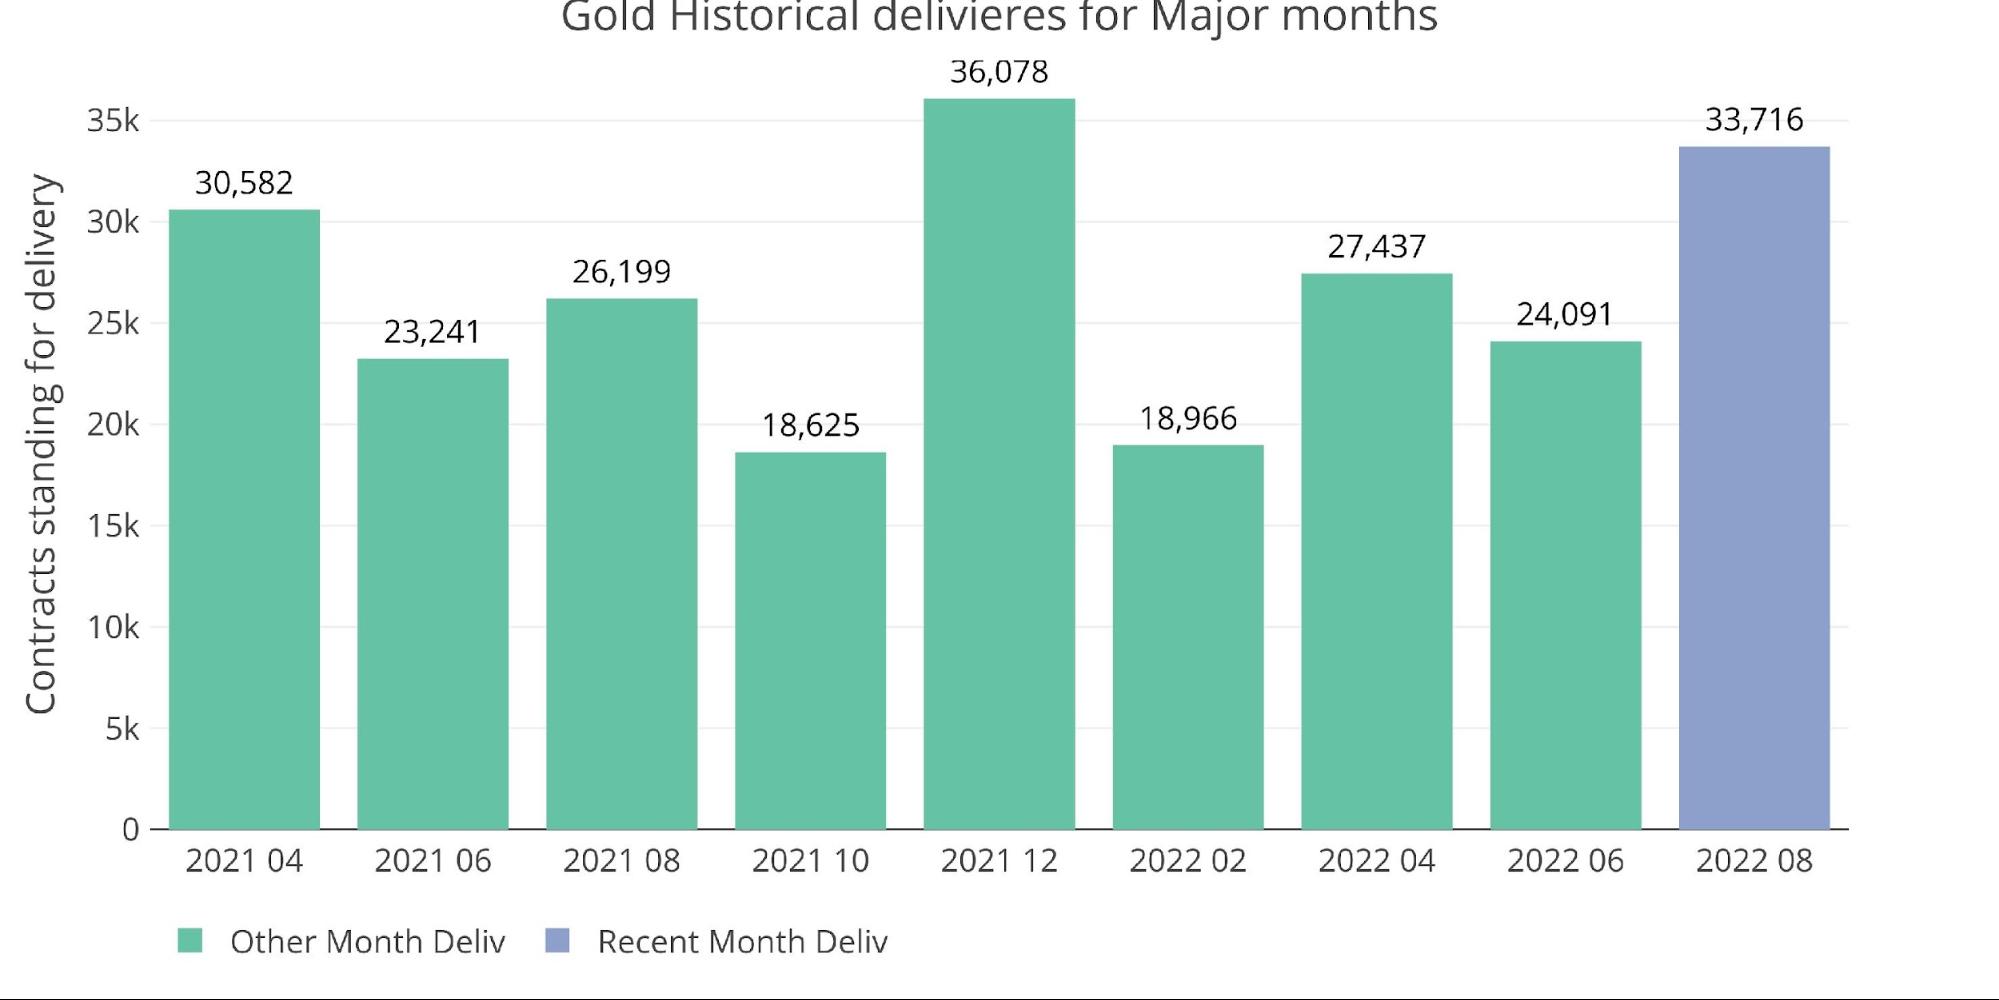
The delivery strength in major months has held up quite well over the last year and a half. Last October was the weakest month over that time with 18,625 contracts delivered. This October is definitely on pace to come in above that.
Figure: 7 Historical Deliveries
Spreads
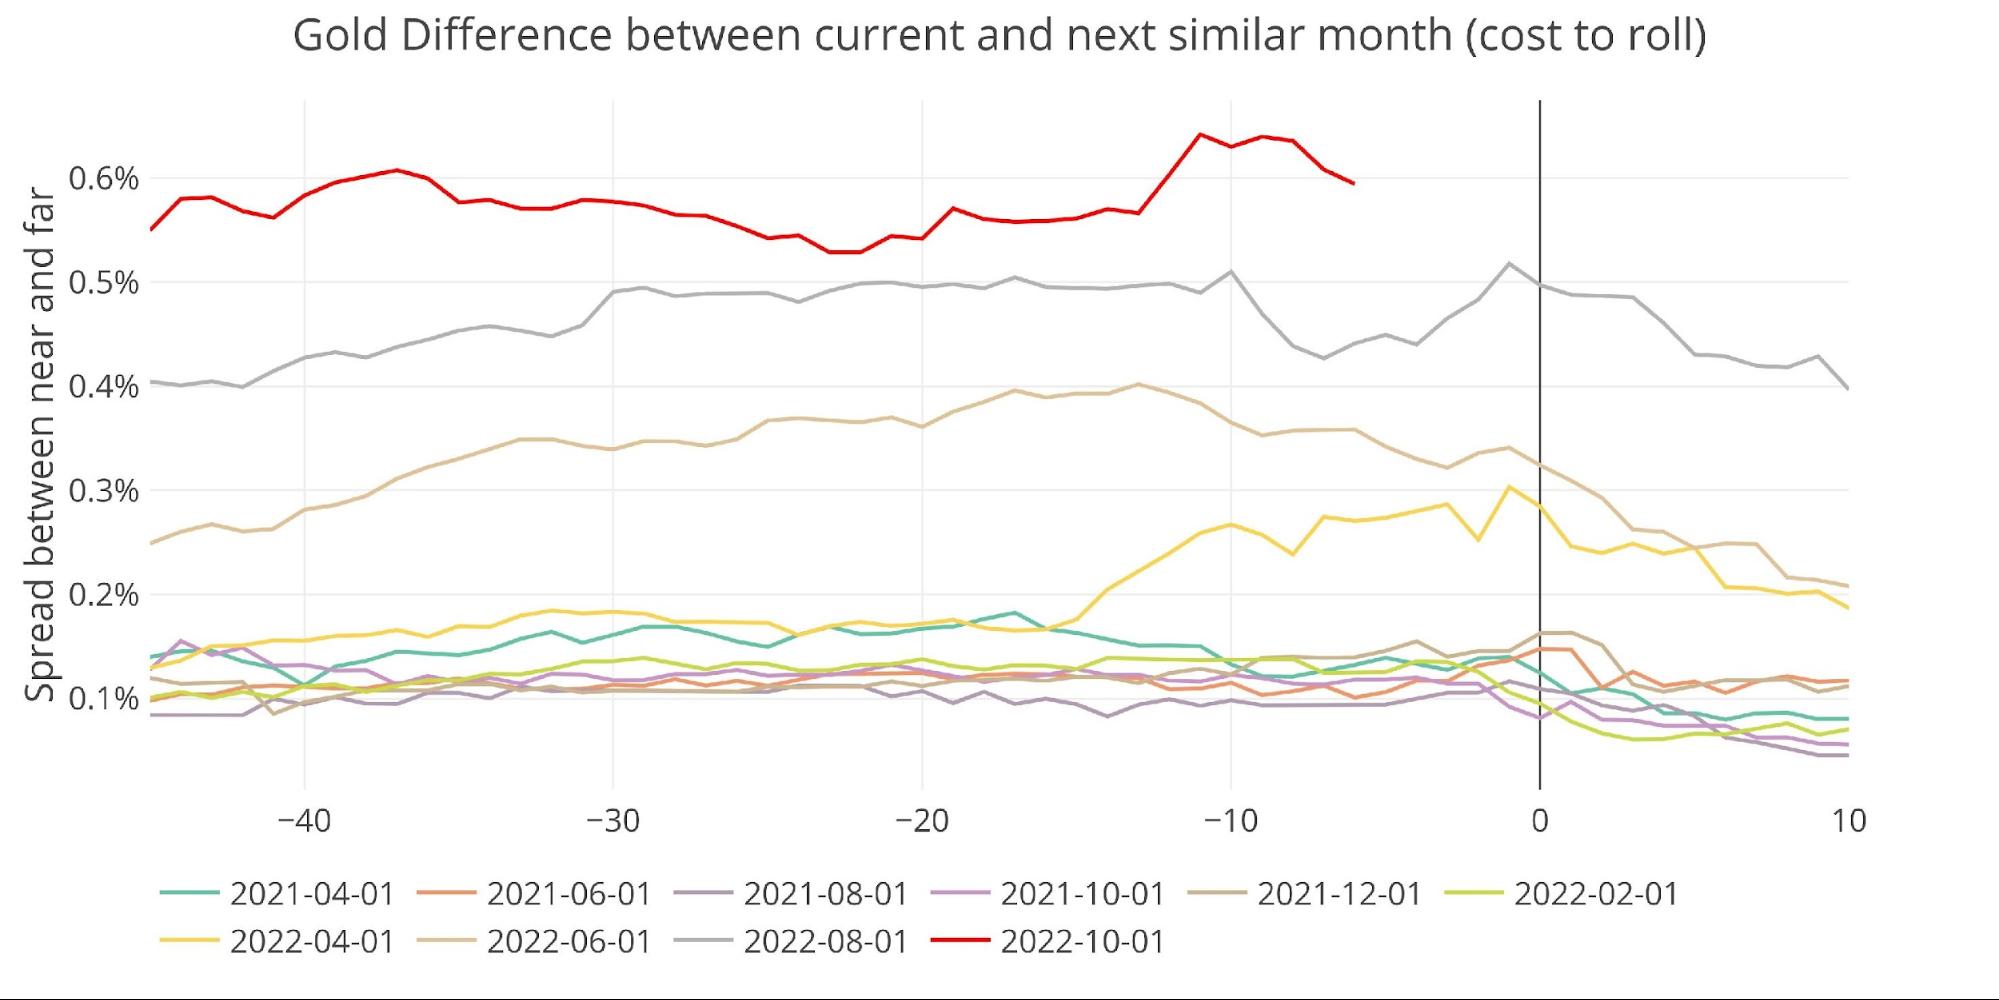
The gold market remains in healthy contango with the December contract a full $10 above the October contract.
Figure: 8 Futures Spreads
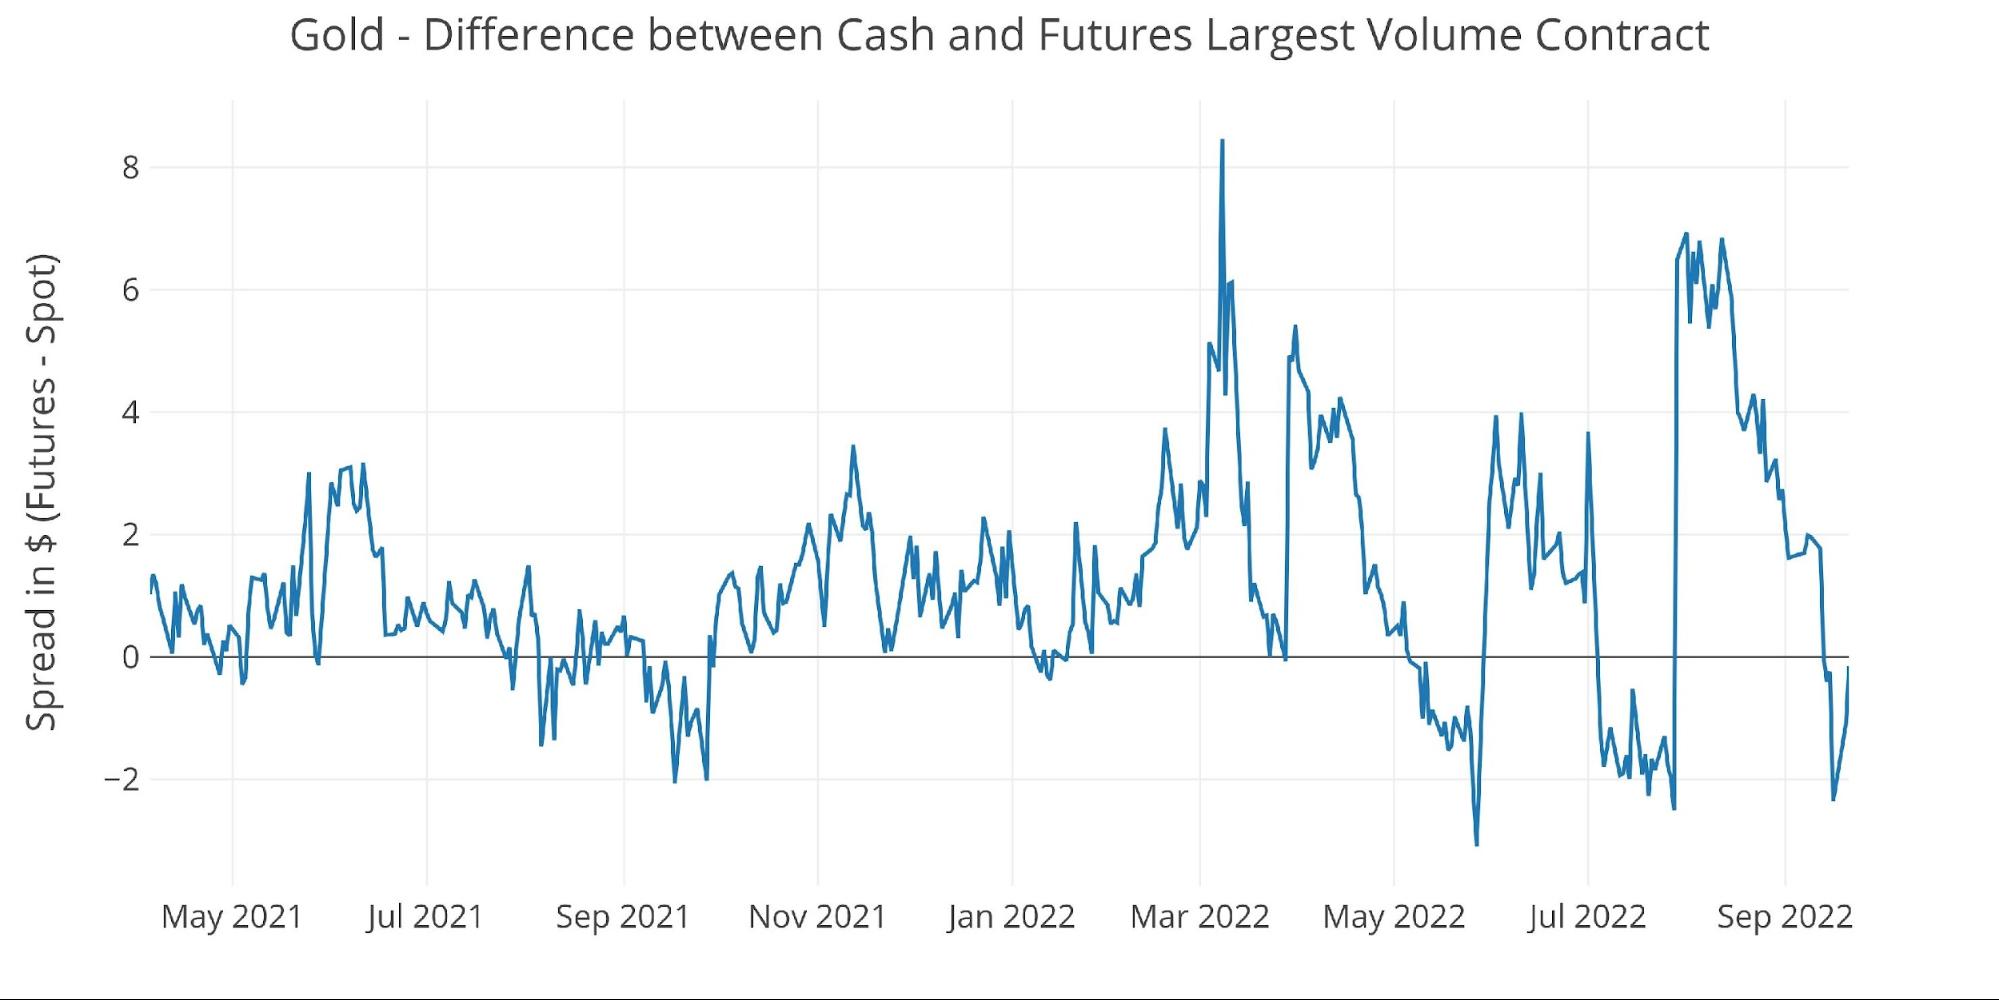
While the futures market is in contango, the spot market has gone back into backwardation (when compared to October). If it holds for the next week, this will be the third time this year that gold has entered backwardation for an extended period. Once the October contract rolls off, it will flip back to contango. Then it becomes a waiting game to see if December will become the fourth major month in a row to enter backwardation.
Reminder: backwardation shows that traders are valuing the spot price higher than the futures price.
Figure: 9 Spot vs Futures
Silver: Recent Delivery Month
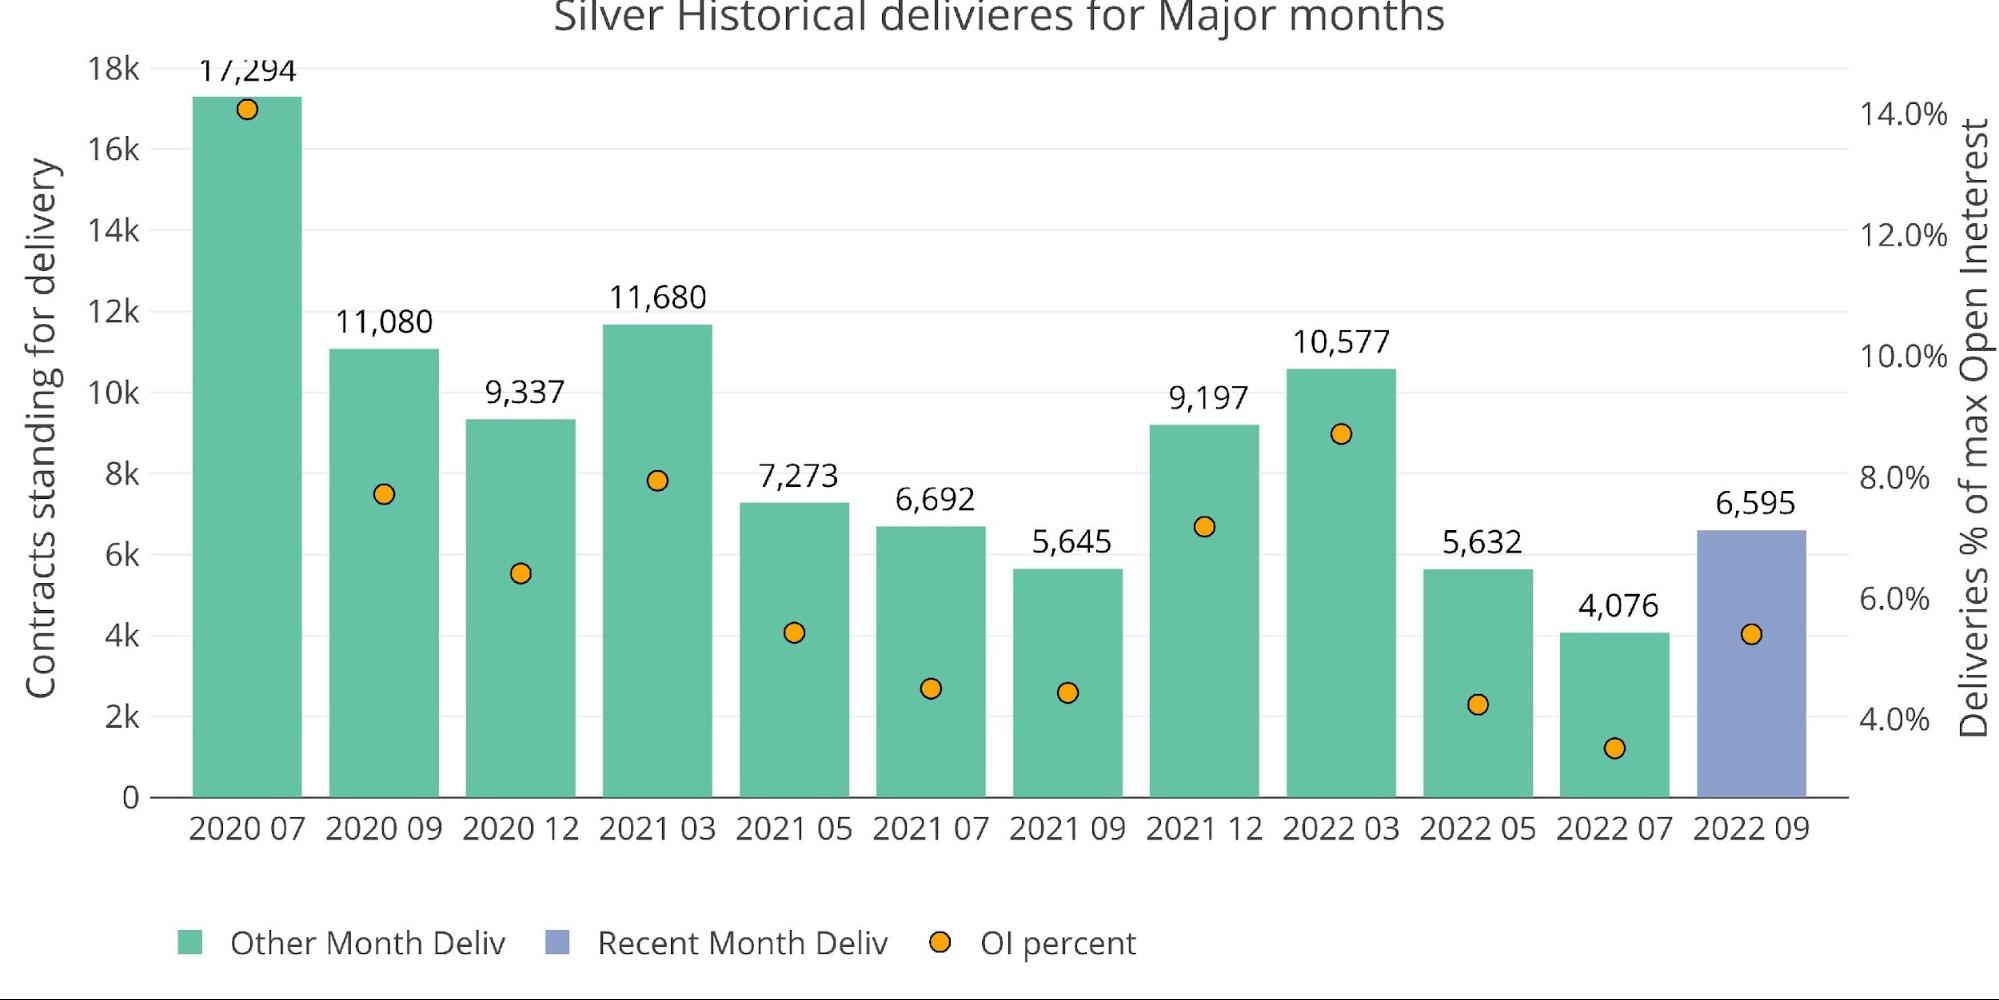
Silver is still seeing relatively weak delivery volume when compared to the last two years. That being said, this month will be the biggest major delivery month since the Russian invasion of Ukraine.
Figure: 10 Recent like-month delivery volume
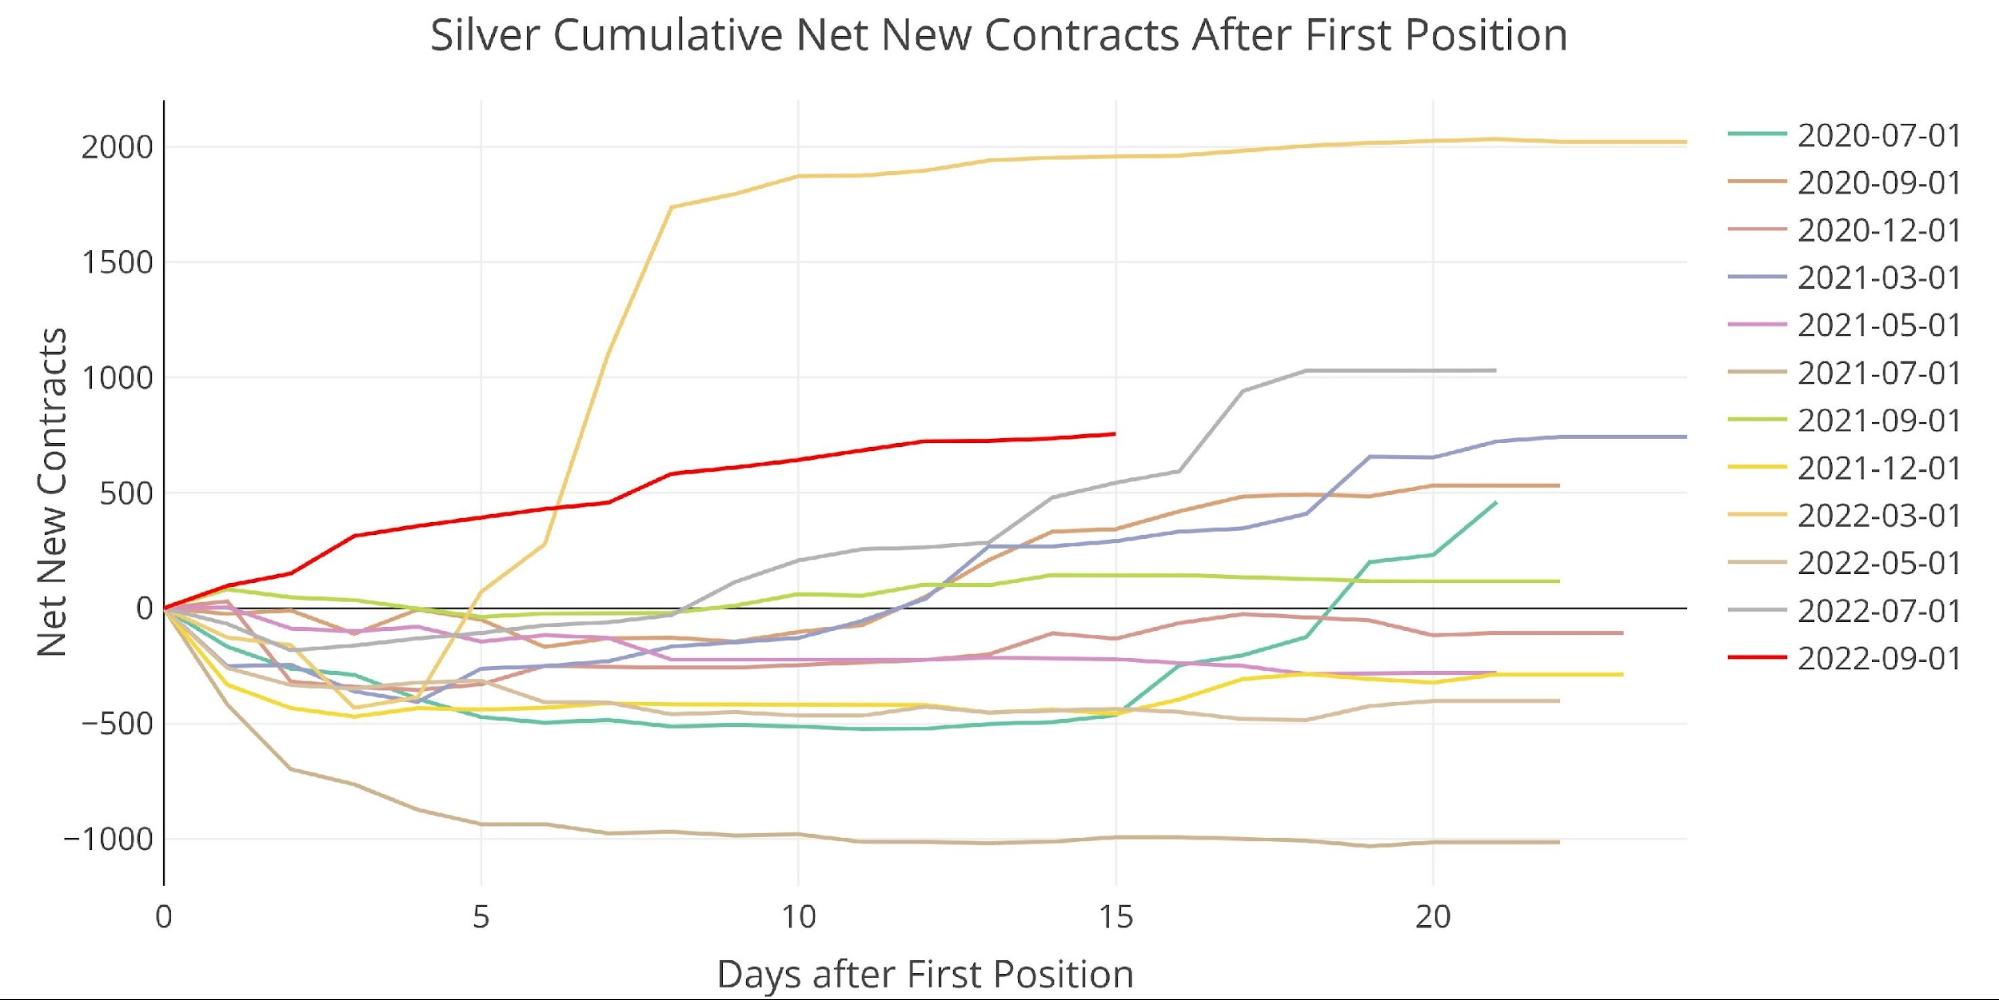
Mid-month activity is the main reason for the recent strength. September is the second strongest major month since March of this year, during the start of the invasion.
Figure: 11 Cumulative Net New Contracts
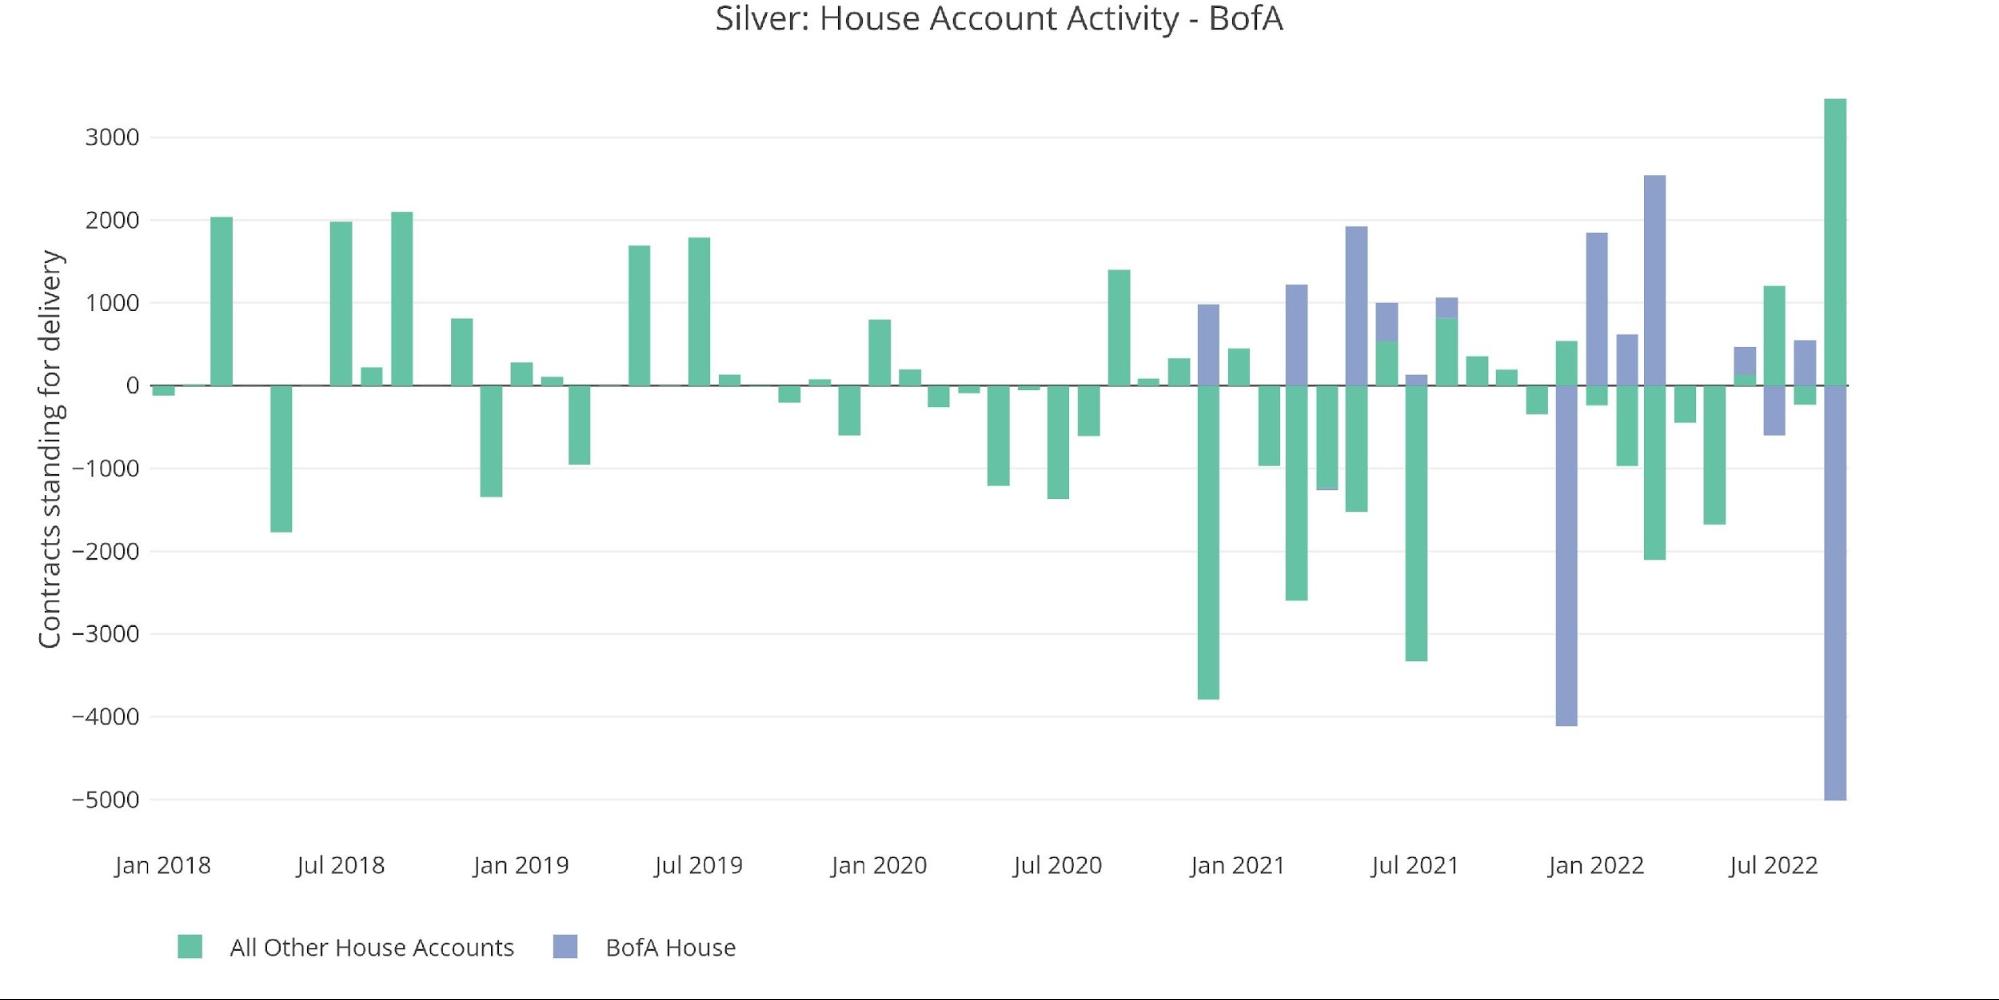
Unlike gold, where the house accounts are very quiet, silver is seeing the biggest house activity ever. BofA house has backstopped the market this month, satisfying more than 75% of the delivery demand.
Figure: 12 House Account Activity
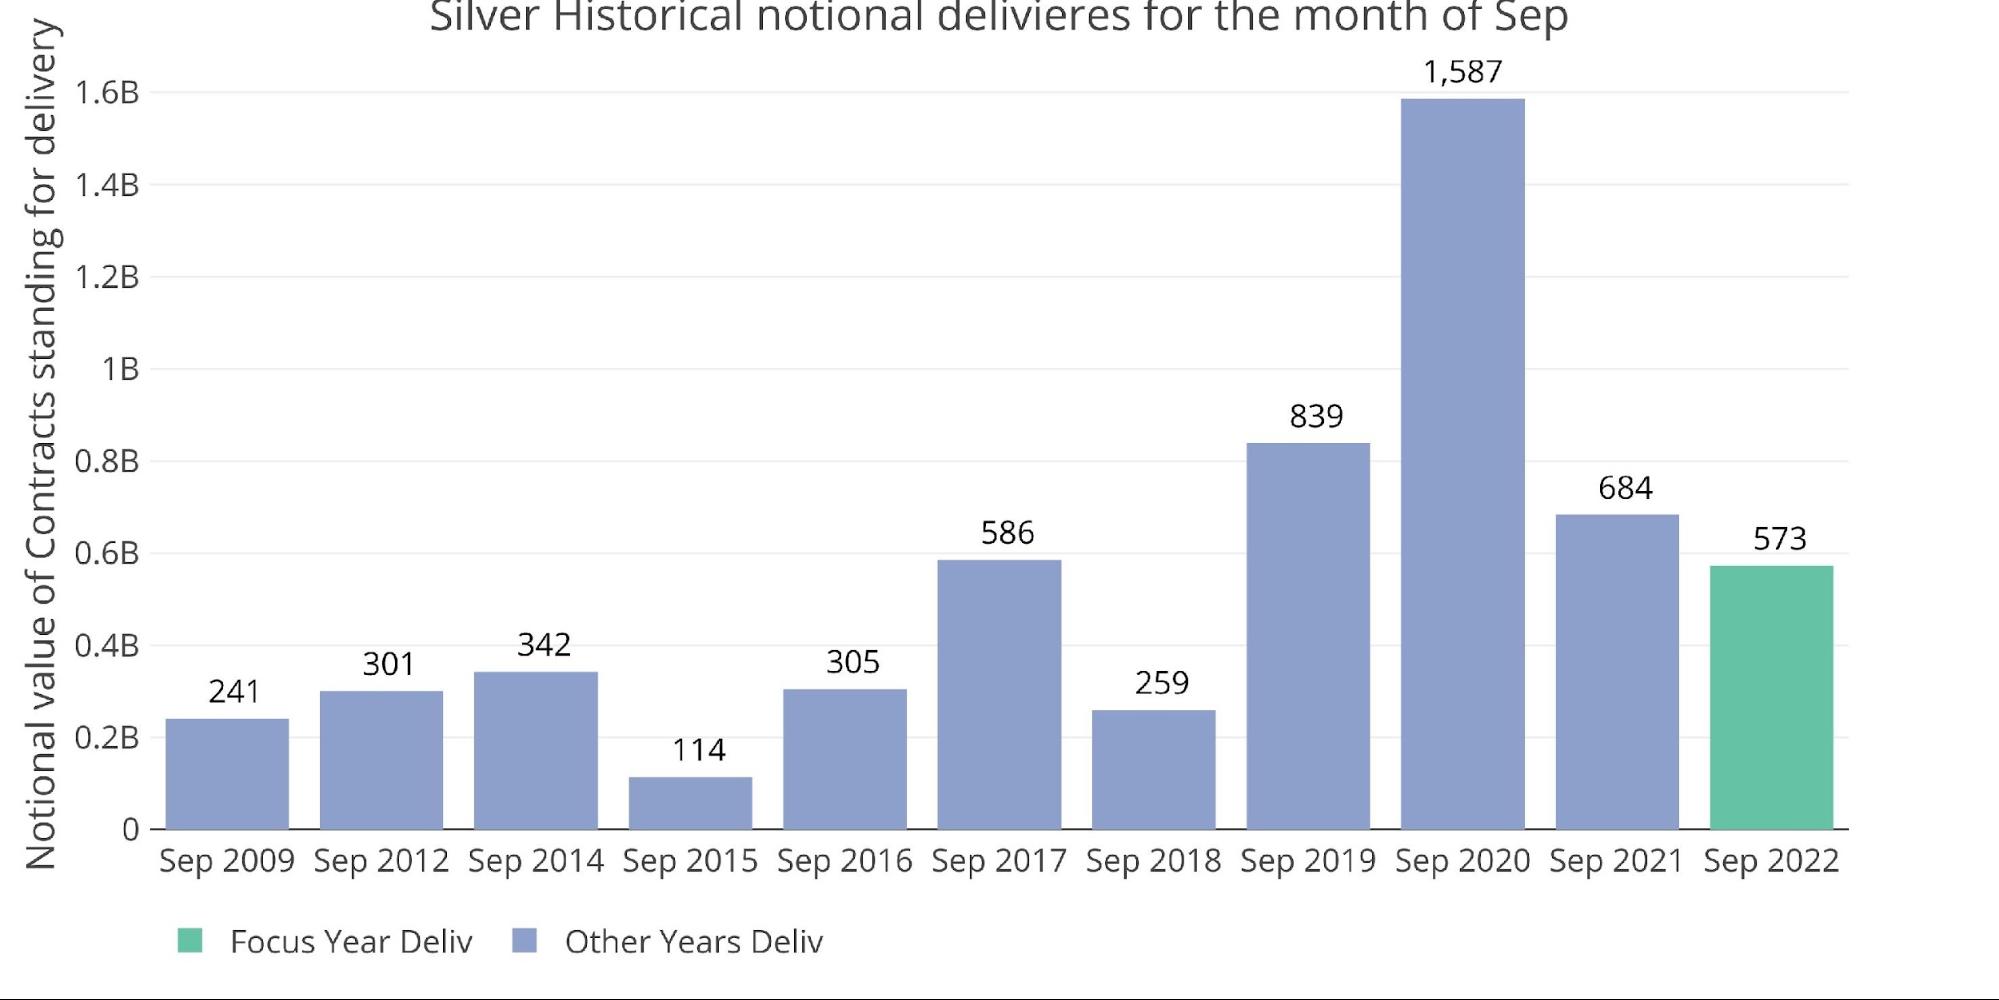
Ironically, despite the recent strength, this September is on pace to be only the fifth strongest September on record.
Figure: 13 Notional Deliveries
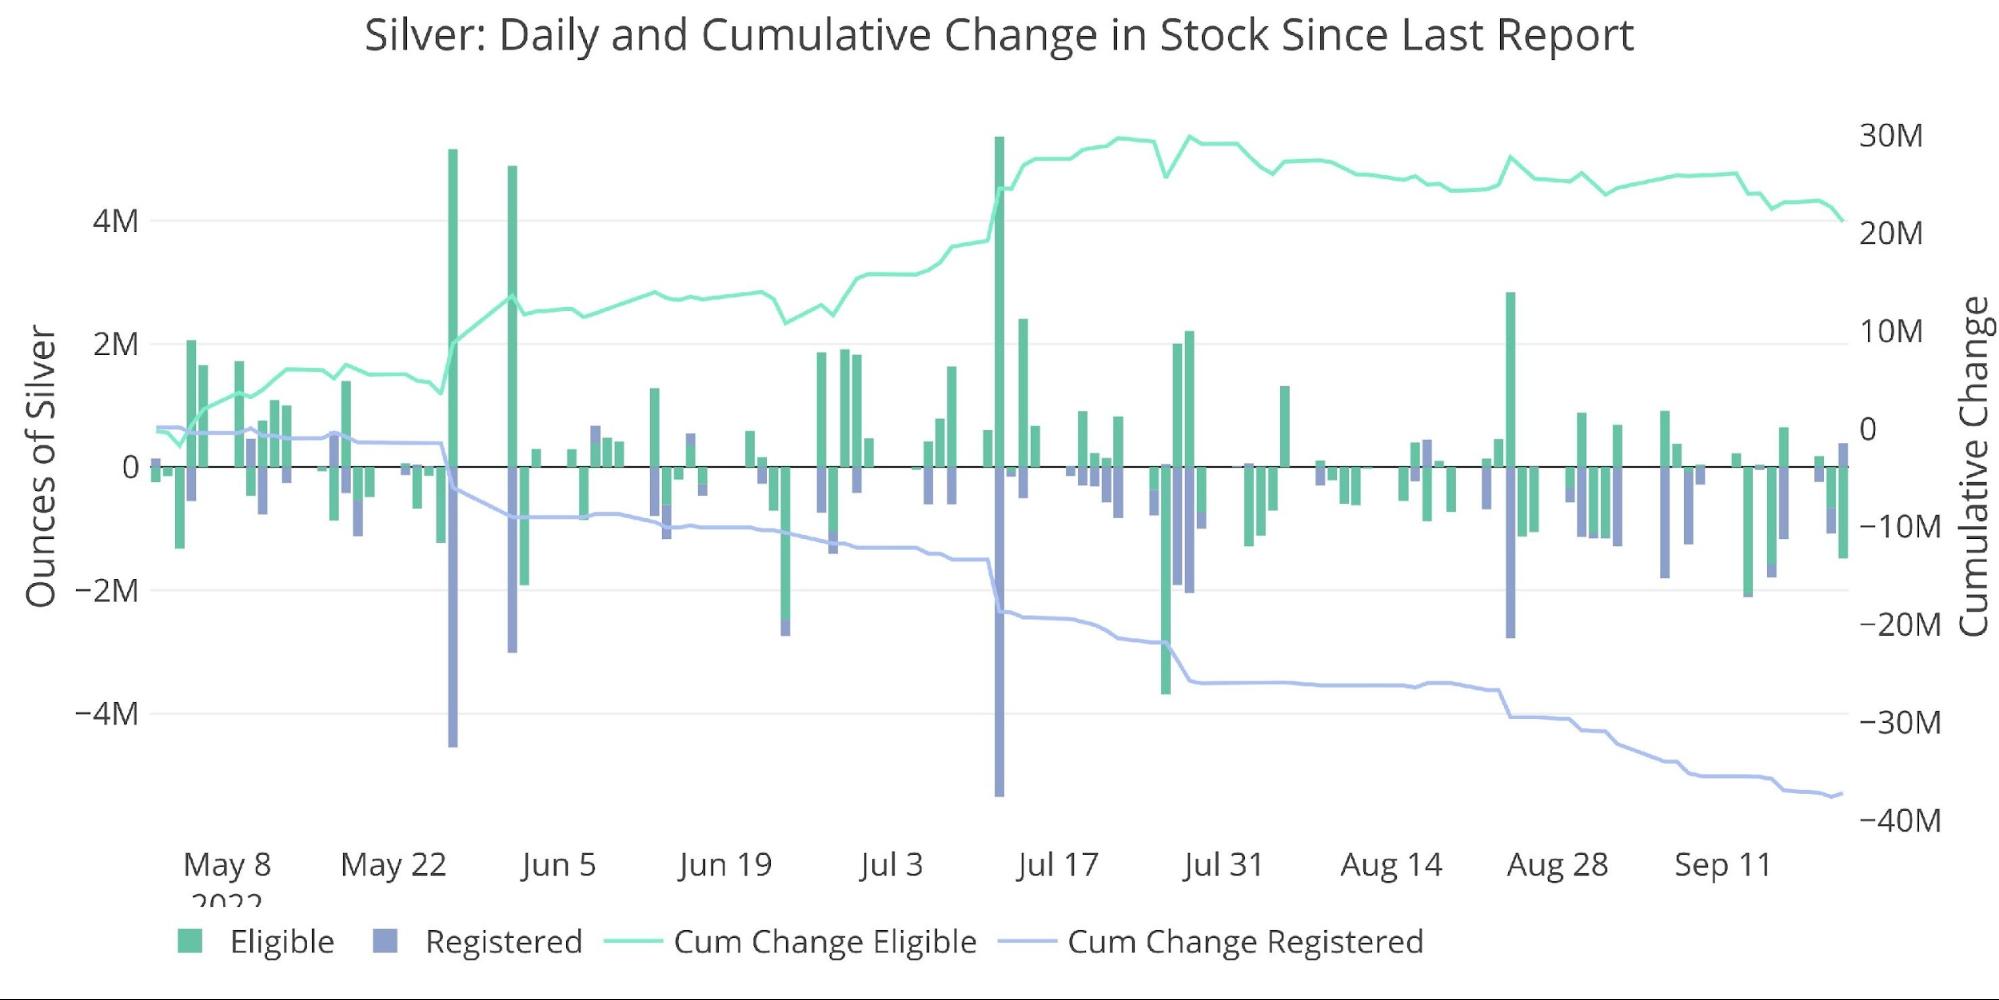
That being said, silver continues to leave Comex vaults at a torrid pace. So, while delivery volume may be slow and the price has been disappointing, both the house accounts and Comex vaults show that there is major activity happening under the surface.
Figure: 14 Recent Monthly Stock Change
Silver: Next Delivery Month
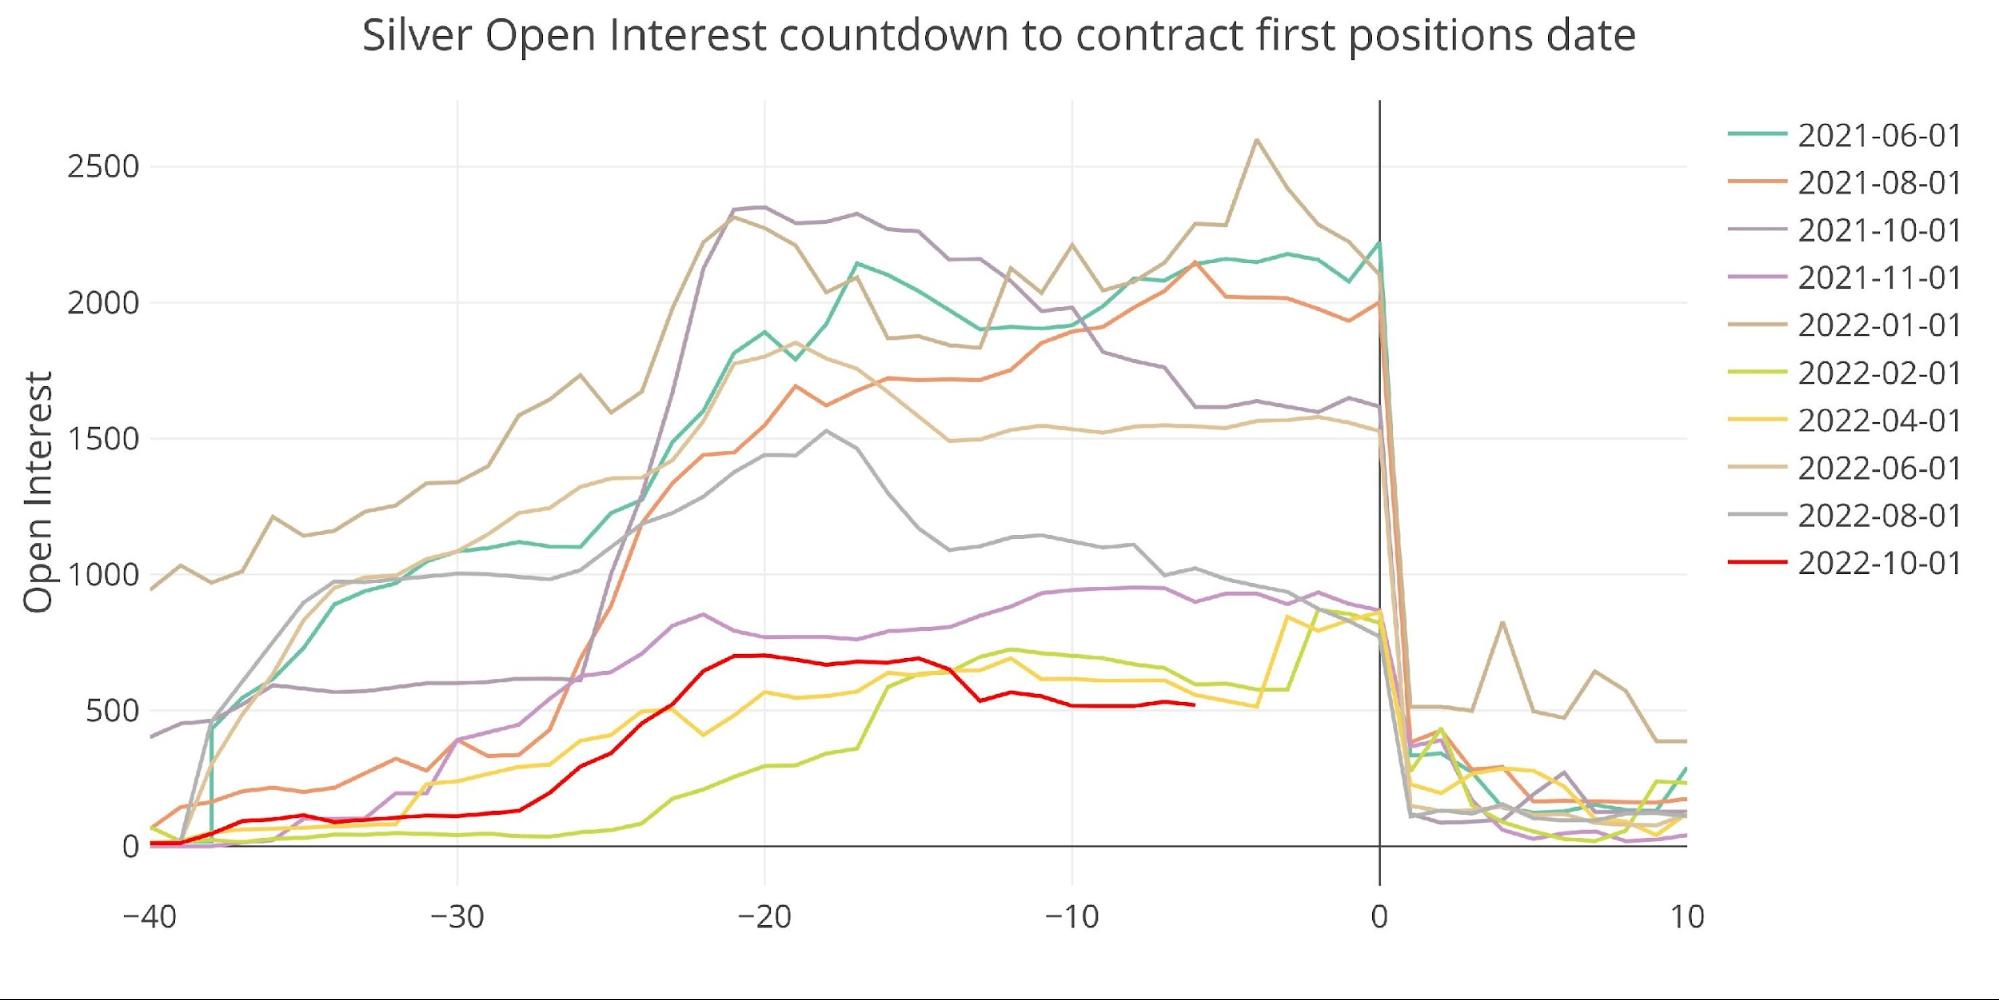
October silver is also looking quite weak, with open interest at the lowest level for a minor contract for the months shown below.
Figure: 15 Open Interest Countdown
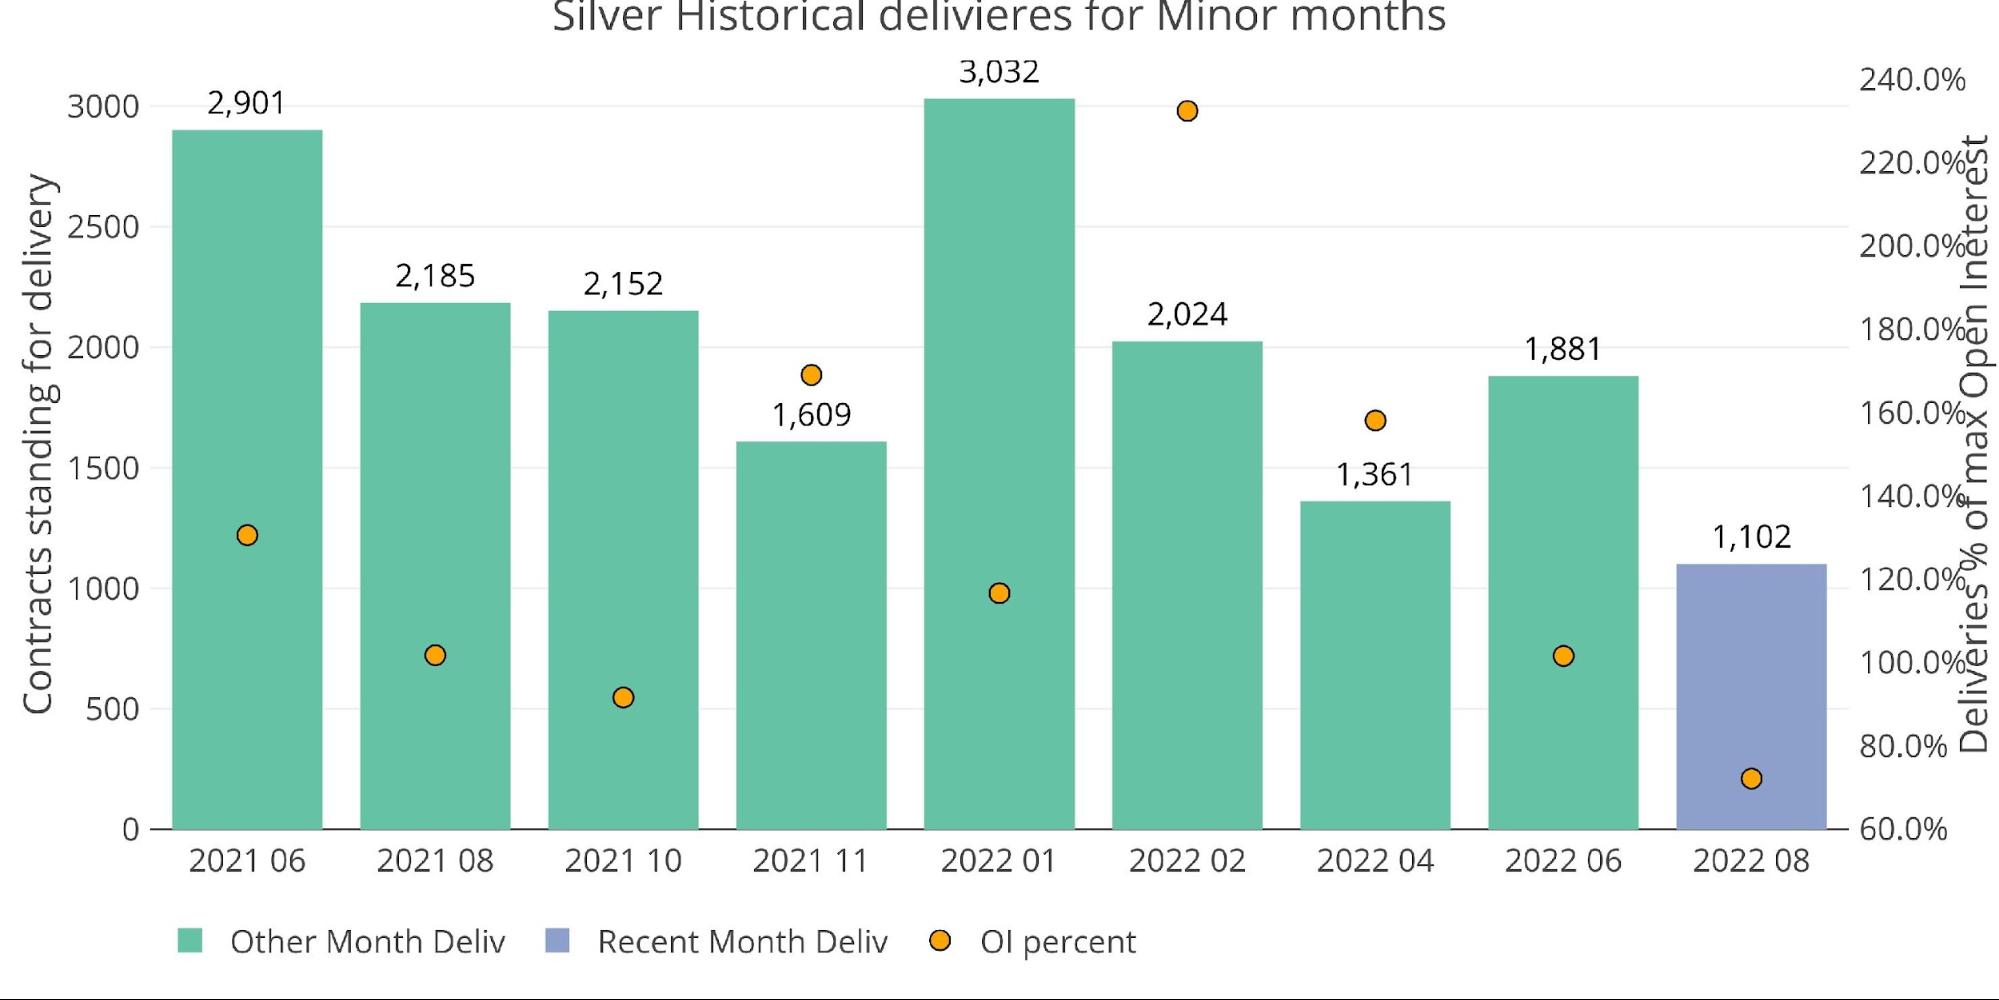
Last month finished quite weak and it looks like that may happen again.
Figure: 16 Historical Deliveries
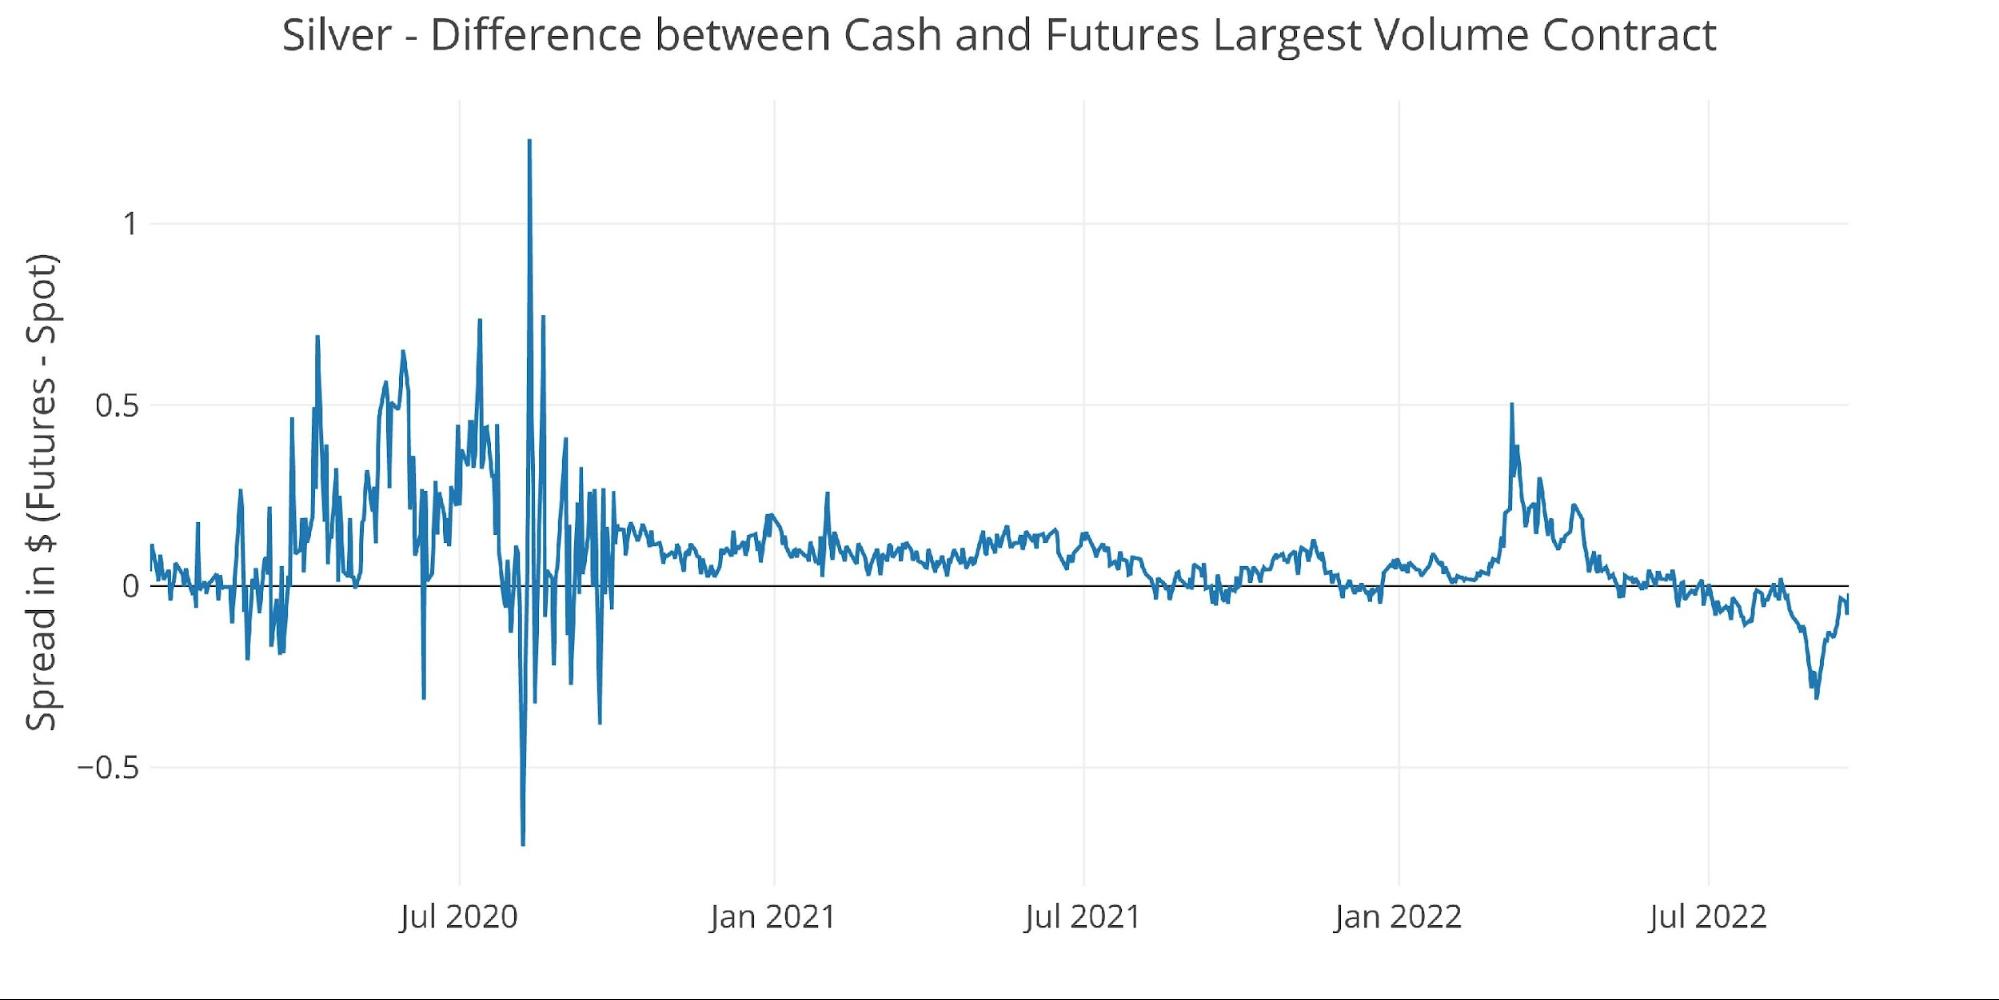
The spot market remains in backwardation when compared to October. Aside from two days in August, the spot market has been in a consistent backwardation since July 1st!
Figure: 17 Spot vs Futures
Wrapping up
Gold is showing strength across all metrics except for bank house account activity. Strong delivery volume, strong mid-month activity, and large removal of physical gold from vaults. While the paper price remains weak, the physical market is showing serious signs of strain.
It’s only a matter of time before the paper gold price starts to reflect the turmoil in the physical market. As inventories drain from the Comex, there will be less and less supply to support the futures market. Eventually a short is going to be caught with no metal to deliver. At that point, the price won’t pop, it will explode!
Silver is a different beast. Most of the futures market is showing depressed activity while under the surface the inventory of Registered metal has been absolutely plummeting in recent months. Things may look calmer than the gold market, but the physical activity is actually in even greater turmoil. Look no further than BofA having to backstop the market with its largest delivery out on record.
The Fed may have successfully talked down the speculative futures traders. But make no mistake, the smart money is gobbling up physical metal at a frantic pace!
Figure: 18 Annual Deliveries
Data Source: https://www.cmegroup.com/
More By This Author:
Atlanta Fed Lowers Q3 GDP Growth Forecast Close To Zero
Retail Sales Headline Reveals Mainstream Cluelessness About Inflation
Comex Stock Report: The Vaults Are Still Bleeding


