
Classic Elliott Analysis Shows Fall In WTI Crude Futures
Read anything today about the fate of WTI Crude and you’ll soon get eye strain in all the Fundamental jargon used to describe what lies ahead. For Technical Analysists, dare I say, Chartists, like myself - looking at WTI Crude shows a classic and clear Elliott Wave pattern. And, one of the great things about using Technical Analysis, is that you can easily employ it to determine the direction of what you are trading.
Let’s look at what classic Elliott Wave Analysis is screaming at us and how we can use it to make money:
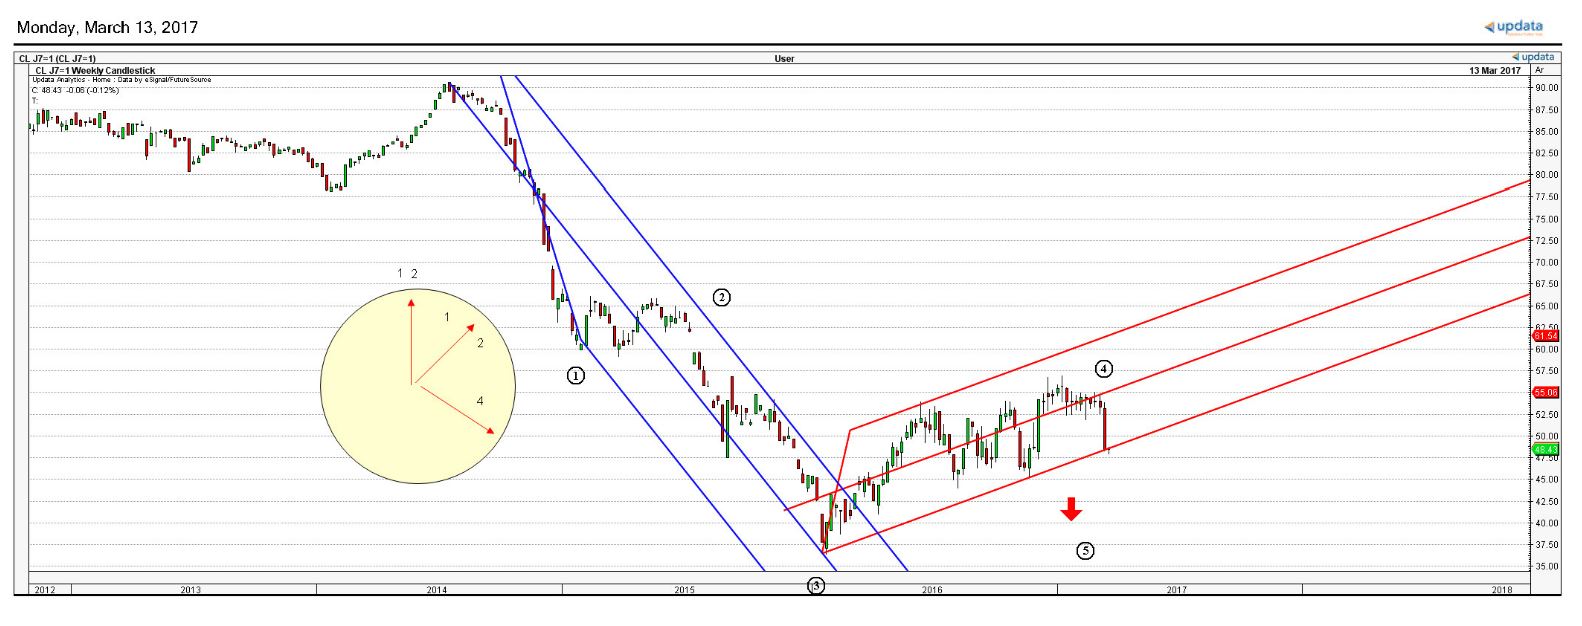
Long Term WTI April Crude Oil Futures (CLJ7) shows an Impulse wave to the downside beginning in mid-2014. This (Wave 1) continues until roughly the end of January 2015, where (Wave 2) begins a (Flat Wave) counter trend/correction that lasts until mid-2015 when (Wave 3) begins. This resumption of the main trend to the downside terminates in January 2016. And although many analysists thought that WTI Crude had reached its bottom and was in a new uptrend, Elliotticians recognized that this was and has been a (Zig Zag) countertrend movement. With that being said, it is clear that a penetration of the lower channel line of roughly $47.90 will begin (Wave 5) and the resumption of the main trend to the downside. This is EXACTLY why you are reading that the big smart money “Commercial” are taking out large short positions vs. the “Non-commercial.”
So how can we be sure that (Wave 5) is starting and it is not a false countertrend move -besides reading about all the Fundamentals, such as “contango,” WTI spreads and other financial idiosyncrasies?
The answer lies in the slope of the waves! Looking at the clock graphic, you’ll notice its hands. Impulsive waves tend to have a steeper slope of anywhere between 12 and 2 o’clock. Conversely, countertrend corrective wave structures tend to a have a gradual slope structure. Looking at (Waves 1, 3) you’ll see that these are classic Impulse waves compared to (Waves 2, 4), which are clearly corrective in nature.
The bottom line is: If you are looking to profit from WTI futures, using this ONE Elliott Wave Technical Analysis methodology, will provide you with a clear directional Long Term trade. Whether you opt to buy LEAP option puts, or day trade the actual WTI (CLJ7) Futures Contract, you can take pride and satisfaction that you did your homework without needing your Reading glasses.
Wave 1:
- Begins - 07/11/2014; Price: $90.65.
- Ends - 01/23/2015; Price: $59.92.
Wave 2:
- Begins - 01/23/2015; Price: $59.92.
- Ends - 06/26/2015; Price: $64.24.
Wave 3:
- Begins - 06/26/2015; Price: $64.24.
- Ends - 01/23/2016; Price: $36.39.
Wave 4:
- Begins - 01/23/2016; Price: $36.39.
- Ends - 03/03/2017; Price: $59.92.
Wave 5:
- Begins - 03/03/2017; Price: $59.92.
Take Short Position at: $47.90.
Let the empirical chart, show confirmation and evidence that penetration of the lower channel line of roughly $47.90 has occurred before initiating any short positions.
(Click on image to enlarge)
Disclosure: None.


Thank you Roger and Anthony for your positive feedback! I'm very busy trading the market right now, but I will be soon posting more - that I believe you will find both informative and actionable.
Enjoyed this, thanks. Have anything more recent?
You have some good stuff. Would like to read more by you.