
Bull And Bear Tug Of War Continues
Yesterday’s movements in gold may have given both bulls and bears reason to think that they are the ones who are right. So, what’s really going on?
Gold finally made its critical move. It broke below its short-term support line and closed the day below it. And that’s clearly bearish.
Let’s jump right into gold’s chart.
The above chart is likely either perplexing, confusing or appearing random for those who haven’t stumbled upon the technical analysis toolkit. But to those who have learned about its principles and have used it themselves, the above chart is very exciting. And to those who took the expertise to the next level and see an even bigger picture, the chart is relatively calm, and normal.
Gold: How Exciting Are Recent Moves?
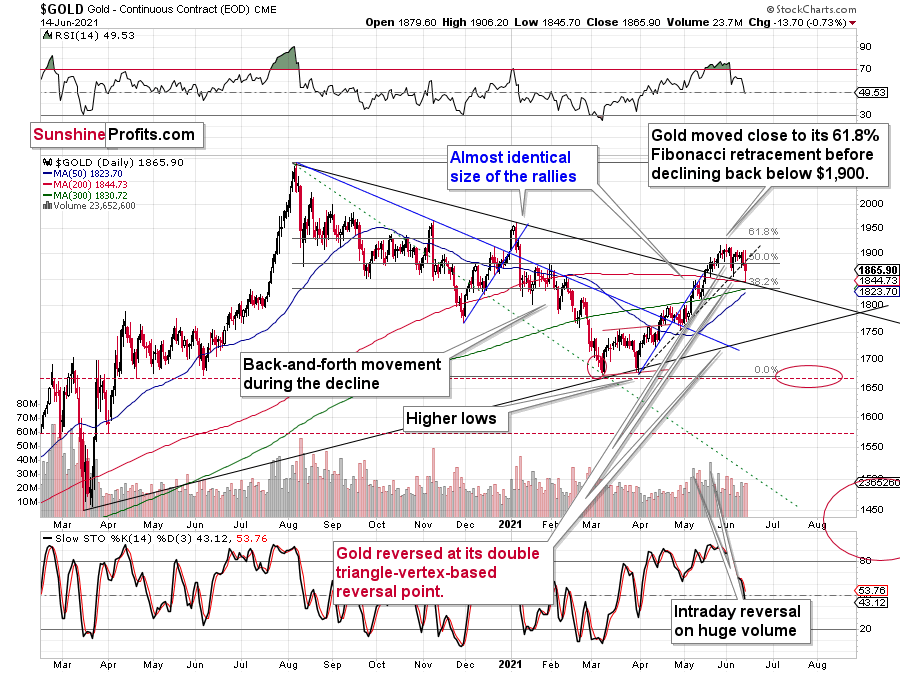
Why would the above chart be so exciting? Because gold just broke below its rising dashed support line and closed the day below it. This is the first time that it managed to do that, despite coming close to it a few times before. The excitement is even bigger because of what happened on an intraday basis – gold moved back to its declining support line based on the 2020 and 2021 highs and then it moved back up. Consequently, based on the same session, both bulls and bears have an indication that “they were right all along”. Was yesterday’s session a major breakdown, or a confirmation of the May breakout?
But how excited can you get if it’s clear that gold is simply repeating its price patterns from the past that were preceded by relatively similar events (invalidation of breakout to new all-time highs – just like in 2008; similarity with regard to price moves, volume, and key indicators – just like in 2011-2012).
Watching a football match is not as exciting when you already know the outcome, is it?
What’s likely to happen now? Gold is likely to move back and forth, but will ultimately break below the declining support line, which will be a major “uh-oh” moment for those who think that gold will move higher from here based on the very positive fundamental situation. Yes, it is very positive, but it doesn’t mean that gold would rally right away. It could decline despite the fundamentals, just like it did in 2008 and in 2013. And it seems that it’s about to slide.
My previous comments on the analogies to 2008 and 2012 remain up-to-date:

Back in 2008, gold corrected to 61.8% Fibonacci retracement, but it stopped rallying approximately when the USD Index started to rally, and the general stock market accelerated its decline.
Taking into consideration that the general stock market has probably just topped, and the USD Index is about to rally, then gold is likely to slide for the final time in the following weeks/months. Both above-mentioned markets support this bearish scenario and so do the self-similar patterns in terms of gold price itself.
Moreover, while the pace of gold’s decline in 2012 started off slow, the momentum picked up later on as the drawdown became even more vicious. As a result, the tepid pace of gold’s current slide remains deceptive and isn’t a cause for concern.
Please see below:
The relatively broad bottom with higher lows is what preceded both final short-term rallies – the current one, and the 2012 one. Their shape as well as the shape of the decline that preceded these broad bottoms is very similar. In both cases, the preceding decline had some back-and-forth trading in its middle, and the final rally picked up pace after breaking above the initial short-term high.
Interestingly, the 2012 rally ended on huge volume, which is exactly what we saw also on May 19 this year. Consequently, forecasting much higher silver or gold prices here doesn’t seem to be justified based on the historical analogies.
The thing I would like to emphasize here is that gold didn’t form the final top at the huge-volume reversal on Sep. 13, 2012. It moved back and forth for a while and moved a bit above that high-volume top, and only then the final top took place (in early October 2012).
The same happened in September and in October 2008. Gold reversed on huge volume in mid-September, and it was approximately the end of the rally. The final top, however, formed after some back-and-forth trading and a move slightly above the previous high.
Consequently, the fact that gold moved a bit above its own high-volume reversal (May 19, 2021) is not an invalidation of the analogy, but rather its continuation.
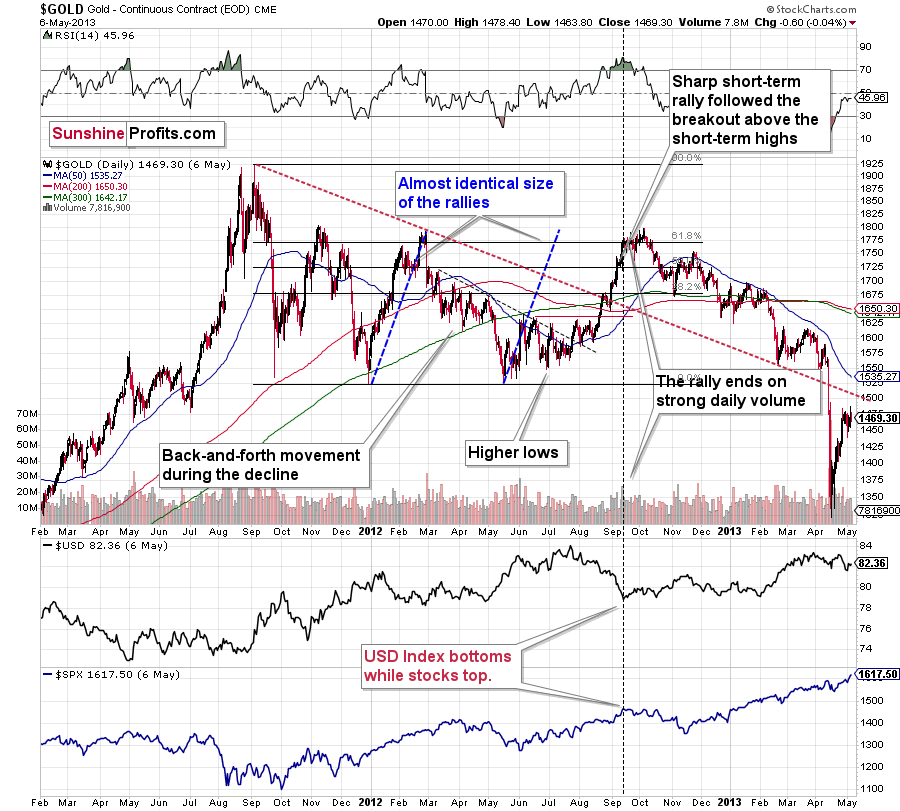
There’s one more thing I would like to add, and it’s that back in 2012, gold corrected to approximately the 61.8% Fibonacci retracement level – furthermore, the same happened in 2008 as you can see in the below chart. Consequently, the fact that gold moved above its 50% Fibonacci retracement doesn’t break the analogy either. And even if gold moves to $1,940 or so, it will not break it. It’s not likely that it is going to move that high, as in both cases –in 2008 and 2012 – gold moved only somewhat above its high-volume reversal before forming the final top. So, as this year’s huge-volume reversal took place close to the 50% retracement and not the 61.8% retracement, it seems that we’ll likely see a temporary move above it, which will create the final top. And that’s exactly what we see happening so far this week.
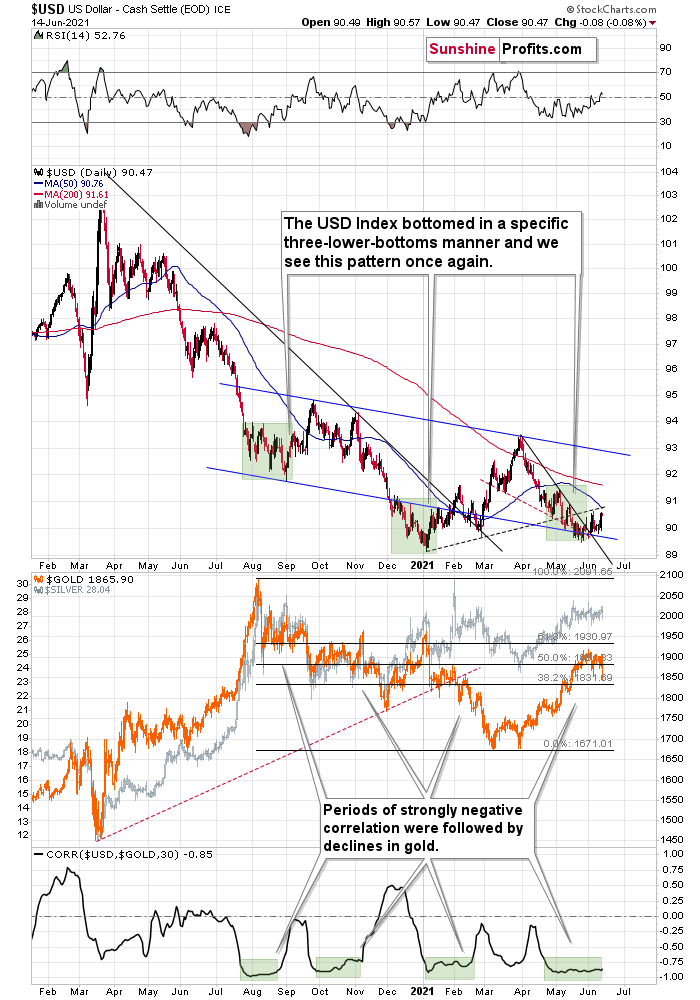
The lower part of the above chart shows how the USD Index and the general stock market performed when gold ended its late-2012 rally and was starting its epic decline. In short, that was when the USD Index bottomed, and when the general stock market topped.
Also, please note that while it might seem bullish that gold managed to rally above its declining black resistance line recently (the one based on the 2020 top and the 2021 top), please note that the same happened in 2012 – I marked the analogous line with red. The breakout didn’t prevent gold from sliding. When the price reached the line, we saw a short-term bounce, but nothing more than that – the gold price fell through it in the following weeks.
The same with silver.
Silver’s Failed Attempts to Break Out
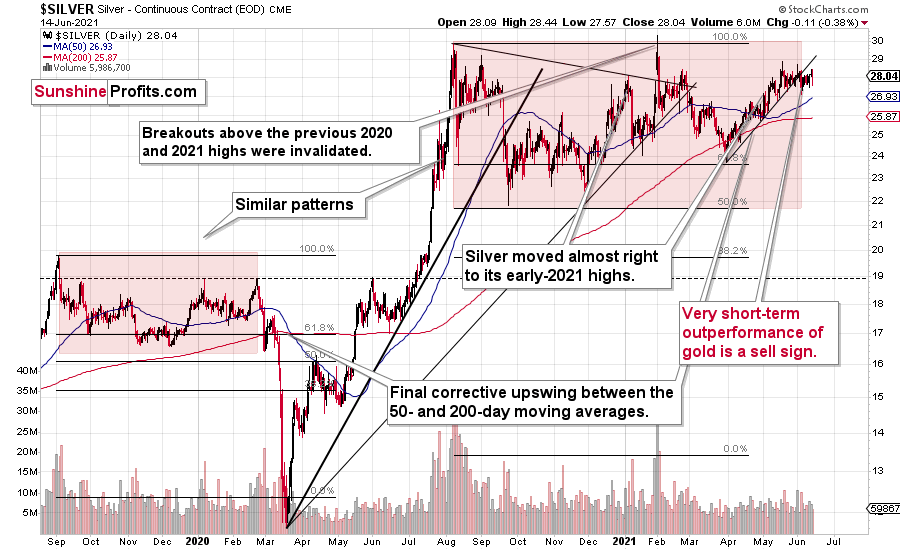
Silver confirmed its breakdown and is finished invalidating its fourth attempt to break above the early January highs. We currently see a fifth attempt, which is unlikely to succeed given the above-mentioned breakdown. This is a clearly bearish combination, even without taking into account the similarity between now, 2020, and 2008.
Let’s keep in mind that silver might hesitate to decline substantially at first, but then play a huge catch-up close to the end of the decline – just as it did in 2020.
Miners: Breaking Below Support Lines Without USDX Help
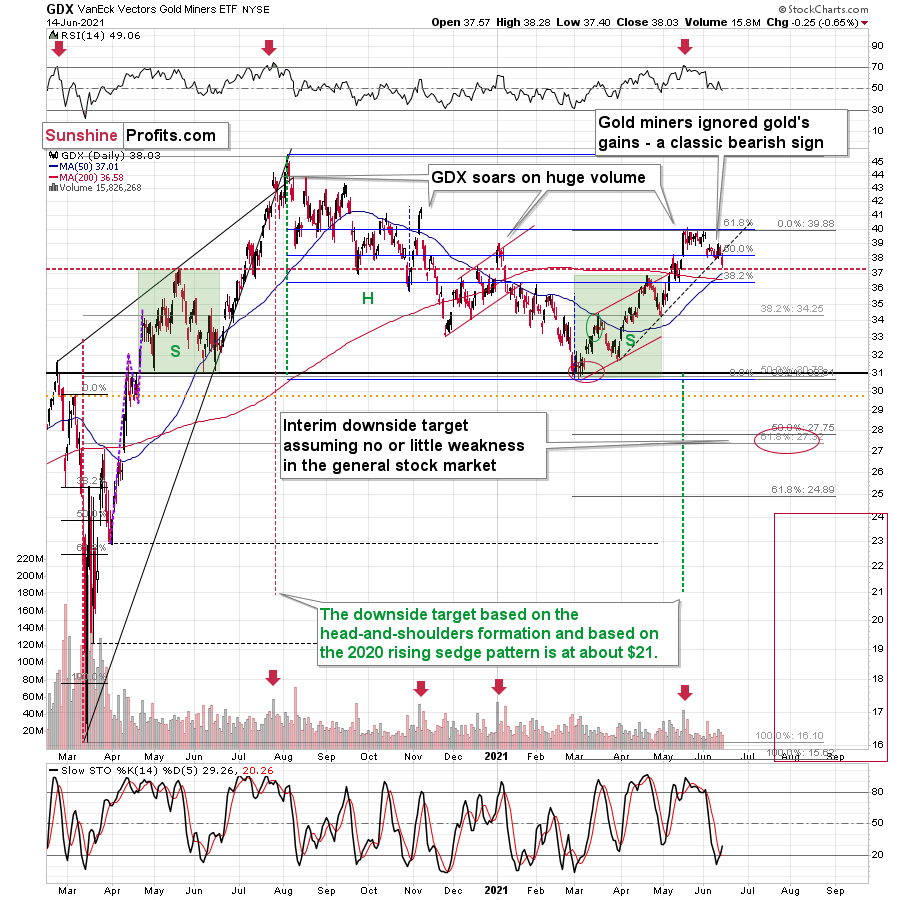
The breakdown in the GDX ETF is also crystal clear. We saw a buy signal from the stochastic indicator, but the breakdown in terms of closing prices is more important, as the buy signals from the stochastic (below 20) were not that reliable so far this year. Please note that the mid-January buy signal was followed by much lower prices in the following weeks. The same was the case with the first buy signal that we saw in late February.
What’s particularly interesting is that gold and gold miners broke decisively below their rising support lines without the USD Index’s help. This is a sign of weakness in the PM market.
Disclaimer: All essays, research and information found on the Website represent the analyses and opinions of Mr. Radomski and Sunshine Profits' associates only. As such, it may prove wrong ...
more

