
Better Permian Breakevens Pressure OPEC
The Midland Basin (part of the Permian Basin, which straddles Texas and New Mexico) has some of the best economics in the country and it continues to influence world oil prices. We have provided average type curves by operator in the graph below.
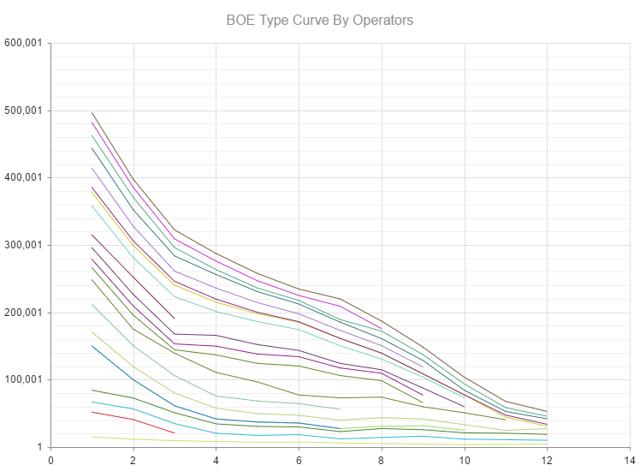
(Source: Welldatabase.com)
Exxon (NYSE:XOM), RSP Permian (NYSE:RSPP), Pioneer (NYSE:PXD), and Parsley (NYSE:PE) are just a few of the names included. Total production by operator is shown below for the time frames provided.
|
Name |
Well Count |
CUM Gas (MCF) |
CUM Oil (BBL) |
|
PIONEER NATURAL RES. |
92 |
12,358,879 |
9,343,536 |
|
XTO ENERGY, INC. |
65 |
7,536,419 |
4,404,378 |
|
CHEVRON USA, INC. (NYSE:CVX) |
28 |
2,991,988 |
2,389,463 |
|
RSP PERMIAN, LLC |
20 |
712,689 |
1,134,696 |
|
CALLON PETROLEUM (NYSE:CPE) |
17 |
1,454,733 |
1,348,784 |
|
DIAMONDBACK E&P (NASDAQ:FANG) |
13 |
810,714 |
1,510,360 |
|
ENCANA OIL & GAS (NYSE:ECA) |
10 |
2,807,849 |
1,180,414 |
|
APACHE CORPORATION (NYSE:APA) |
8 |
1,324,208 |
413,917 |
|
COG OPERATING LLC (NYSE:CXO) |
7 |
533,940 |
621,690 |
|
OXY USA WTP LP (NYSE:OXY) |
5 |
74,902 |
159,435 |
|
ENDEAVOR ENERGY RES |
4 |
614,353 |
501,336 |
|
OCCIDENTAL PERMIAN LTD. |
4 |
143,662 |
474,176 |
|
DISCOVERY OPERATING, INC. |
2 |
626,035 |
231,875 |
|
HUNT OIL COMPANY |
2 |
173,698 |
105,803 |
|
LARIO OIL & GAS COMPANY |
2 |
609,497 |
406,516 |
|
PARSLEY ENERGY OPERATIONS |
2 |
300,665 |
187,143 |
|
BOLD OPERATING, LLC |
1 |
67,054 |
66,067 |
|
DE OPERATING LLC |
1 |
1,004 |
140 |
|
ENERGEN RESOURCES CORP (NYSE:EGN) |
1 |
107,601 |
90,951 |
|
HENRY RESOURCES LLC |
1 |
77,849 |
106,876 |
(Source: Welldatabase.com)
Some of the biggest and best operators are in Midland County. Its thick payzone and multiple intervals provide upside to downspacing and de-risking going forward.
(Source: Welldatabase.com)
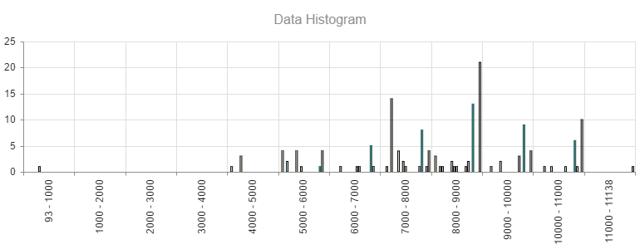
Lateral lengths in Midland are longer than in the Delaware Basin. The largest number range between 7,000 and 9,000 feet. Some are testing over 11,000 feet. This could prove beneficial to the western Permian, as production per foot has been better.
|
Volumetrics |
||
|
EUR: |
120,193.87 BO |
|
|
Months: |
12 |
|
|
NRI (%): |
75 |
|
|
Selling Price: |
$50 |
|
|
Initial Capital Expense: |
$6,528,000 |
|
|
Lease Operating Cost (monthly): |
$82,132 |
|
|
Total |
NRI |
|
|
Total: |
$6,009,693.31 |
$4,507,269.98 |
|
Recovered: |
$6,009,693.31 |
$4,507,269.98 |
|
Total |
NRI |
|
|
Total: |
($7,513,584.00) |
($7,513,584.00) |
|
Recovered: |
($7,513,584.00) |
($7,513,584.00) |
|
Total |
NRI |
|
|
Total: |
($1,503,890.69) |
($3,006,314.02) |
|
Recovered: |
($1,503,890.69) |
($3,006,314.02) |
(Source: Welldatabase.com)
All operators provide excellent average. The results improve significantly when we include only Encana, Pioneer, and Diamondback. These are the top three with respect to production results.
|
Volumetrics |
||
|
EUR: |
146,322.88 BO |
|
|
Months: |
12 |
|
|
NRI (%): |
75 |
|
|
Selling Price: |
$50 |
|
|
Initial Capital Expense: |
$6,528,000 |
|
|
Lease Operating Cost (monthly): |
$82,132 |
|
|
Total |
NRI |
|
|
Total: |
$7,316,143.92 |
$5,487,107.94 |
|
Recovered: |
$7,316,143.92 |
$5,487,107.94 |
|
Total |
NRI |
|
|
Total: |
($7,513,584.00) |
($7,513,584.00) |
|
Recovered: |
($7,513,584.00) |
($7,513,584.00) |
|
Total |
NRI |
|
|
Total: |
($197,440.08) |
($2,026,476.06) |
|
Recovered: |
($197,440.08) |
($2,026,476.06) |
(Source: Welldatabase.com)
The economic improvements are significant, especially when we consider the 12 month well life. These results provide the reasons for continued production improvements from the Permian. Although the Gulf has been a large part of this, we continue to see the Permian perform very well at low oil prices. While service costs rise, it may not be that big of a deal. We continue to see large production improvements, and this should help to counter higher future costs.
Disclosure: Data for the above article is provided by welldatabase.com. This article is limited to the dissemination of general information pertaining to its advisory services, together with access ...
more

