As USD Index Is Poised To Pop, What Happens To Gold?
(Click on image to enlarge)

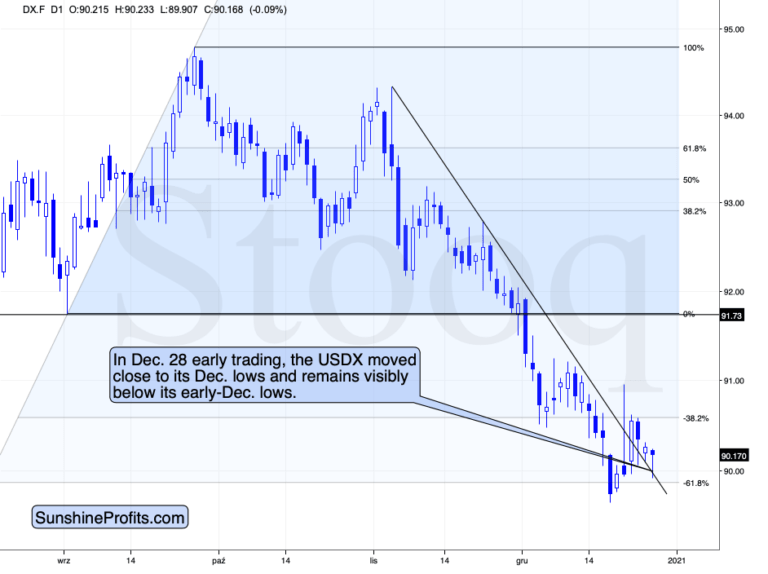
After awakening from its slumber last week, the USD Index may be in the early innings of a short-term breakout. Bursting with energy, the dollar basket closed (on Dec. 22) above its declining resistance line (although more data is needed to confirm a larger move).
Dollar's Epic Comeback
And to quote Francis Bacon, because “we rise to great heights by a winding staircase of small steps,” Tuesday’s ‘small step’ may be the beginning of an epic comeback.
(Click on image to enlarge)

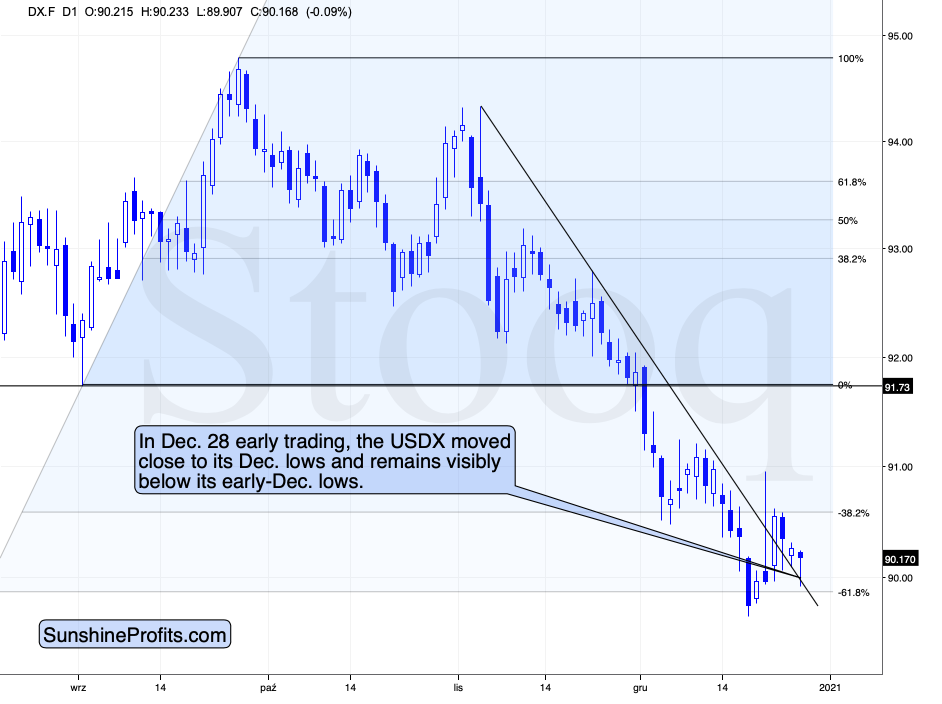
In this week’s early trading, the USDX moved lower and then rallied back up, after touching its previous resistance line, which now appears to have turned into support. Despite the initial decline, the USDX is now more or less where it had started this week’s trading. Its ability to reverse the initial decline appears bullish.
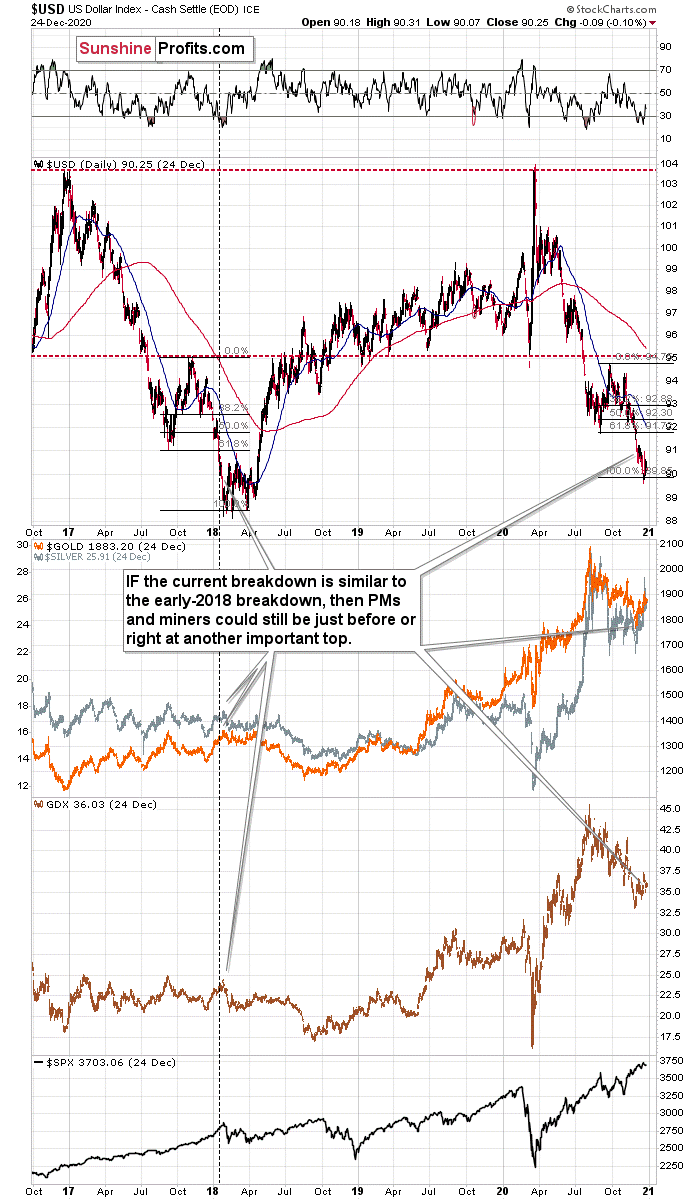
While the USDX traded lower-to-flat from Dec. 23 – 25, the price action still follows a familiar playbook: In 2018, the USDX dipped below the 1.618 Fibonacci extension level before circling back with a vengeance (The initial bottom occurred in early 2018, with the final bottom not far behind.) Moreover, the 2018 USD Index bottom also marked the 2018 top in gold, silver, and the gold miners (depicted in charts 2 and 3 below).
(Click on image to enlarge)

The Recent Correction
I previously wrote that the USDX was repeating its 2017 – 2018 decline to some extent. The starting points of the declines (horizontal red line) as well as the final high of the biggest correction are quite similar. The difference is that the recent correction was smaller than it was in 2017.
Since back in 2018, the USDX’s bottom was at about 1.618 Fibonacci extension of the size of the correction, we could expect something similar to happen this time. Applying the above to the current situation would give us the proximity of the 90-level as the downside target.
“So, shouldn’t gold soar in this case?” – would be a valid question to ask.
Well, if the early 2018 pattern was being repeated, then let’s check what happened to precious metals and gold stocks at that time.
In short, they moved just a little higher after the USDX’s breakdown. I marked the moment when the U.S. currency broke below its previous (2017) bottom with a vertical line so that you can easily see what gold, silver, and GDX (proxy for mining stocks) were doing at that time. They were just before a major top. The bearish action that followed in the short term was particularly visible in the case of the miners.
The Precious Metals Market In The New Year
Consequently, even if the USD Index is to decline further from here, then the implications are not particularly bullish for the precious metals market.
And as we approach the New Year and beyond, I expect a similar pattern to emerge.
Why so?
First, the USDX is after a long-term, more-than-confirmed breakout. This means that the long-term trend for the U.S. currency is up.
Second, the amount of capital that was shorting the USDX was excessive even before the most recent decline. This means that the USD Index is not likely to keep declining for much longer.
In addition, after last week’s drawdown in gold and the gold miners, the sun appears to be setting on the yellow metal. As ‘buy the dip’ morphs into ‘sell the rally,’ gold’s downtrend is likely to resume. Furthermore, the 2018 analogue signals that the SPX’s (S&P 500 Index) days are also numbered (If you analyze the chart above, you can see that the USDX bottom coincided with the SPX top.)
Fundamentally, the USDX is also poised to pop.
Implications For The USD Index And Gold
On Tuesday (Dec. 22), I highlighted the misguided narrative plaguing the U.S. dollar. In short:
With liquidity spigots on full blast around the world, the U.S. isn’t the only region expanding its money supply (And remember, currencies trade on a relative basis.) In fact, the European Central Bank (ECB) has more assets on its balance sheet than the U.S. Federal Reserve (Fed).
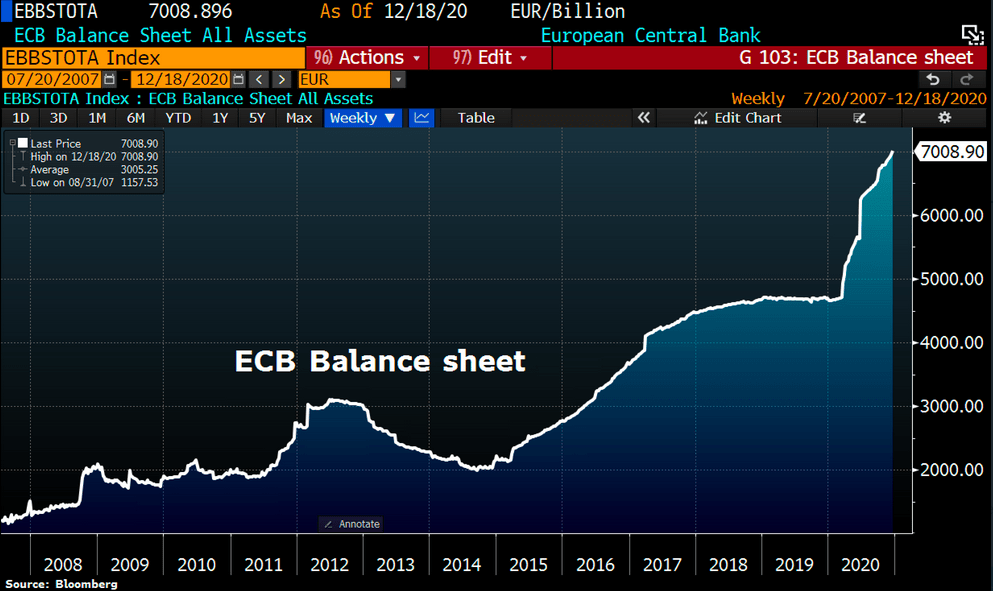
And after another update, the ECB’s spending spree has now reached a record €7 trillion (As a point of reference, the Dec. 22 ECB chart was relative to the Fed, so both balance sheets were presented in U.S. dollars. The chart below depicts the ECB’s balance sheet in euros).
(Click on image to enlarge)

Week-over-week, the ECB’s balance sheet increased by €59 billion. But the real story? The ECB’s total assets now equal 69% of Eurozone GDP – nearly double the Fed’s 35%. So while EUR/USD clawed back some of its early-week losses (after the EU and the U.K. reached a Brexit agreement), its prior three-day downtrend (Dec. 18 – 22) is likely to continue (Remember, movement in the euro accounts for nearly 58% of the movement in the USDX.)
Consequently, the implications for the precious metals market are not as bearish as everyone and their brother seems to tell you. Conversely, the forex market could provide the PMs and mining stocks with a substantial bearish push in the coming weeks – or even days.
Disclaimer: All essays, research, and information found on the Website represent the analyses and opinions of Mr. Radomski and Sunshine Profits' associates only. As such, it may prove wrong ...
more


Prob go down like it did when usd went down. Doesn’t make sense I know but that’s gold for ya