
The Department of Transportation's Federal Highway Commission has released the latest report on Traffic Volume Trends, data through August.
"Travel on all roads and streets changed by +0.7% (+1.9 billion vehicle miles) for August 2022 as compared with August 2021. Travel for the month is estimated to be 289.3 billion vehicle miles." The 12-month moving average was up 0.05% month-over-month and up 4.2% year-over-year. If we factor in population growth, the 12-month MA of the civilian population-adjusted data (age 16-and-over) was down unchanged month-over-month and up 3.2% year-over-year.
Here's a detailed map of regional driving:
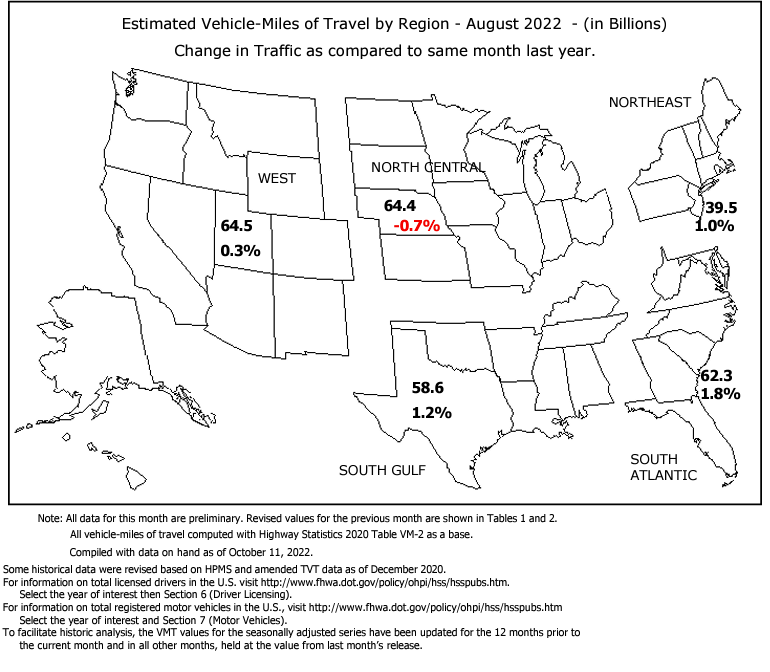
Source: https://www.fhwa.dot.gov/policyinformation/travel_monitoring/22augtvt/22augtvt.pdf
Here is a chart that illustrates this data series from its inception in 1971. It illustrates the "Moving 12-Month Total on ALL Roads," as the DOT terms it. As we can readily see, the Great Recession had a substantial impact on our driving habits, but habits bounced back over the next five or so years. The decline in driving was most likely related to the cost of gasoline during that time period (see the fourth chart below). The COVID-19 pandemic has had a massive impact on driving as Americans are staying home for work, meals, and entertainment.
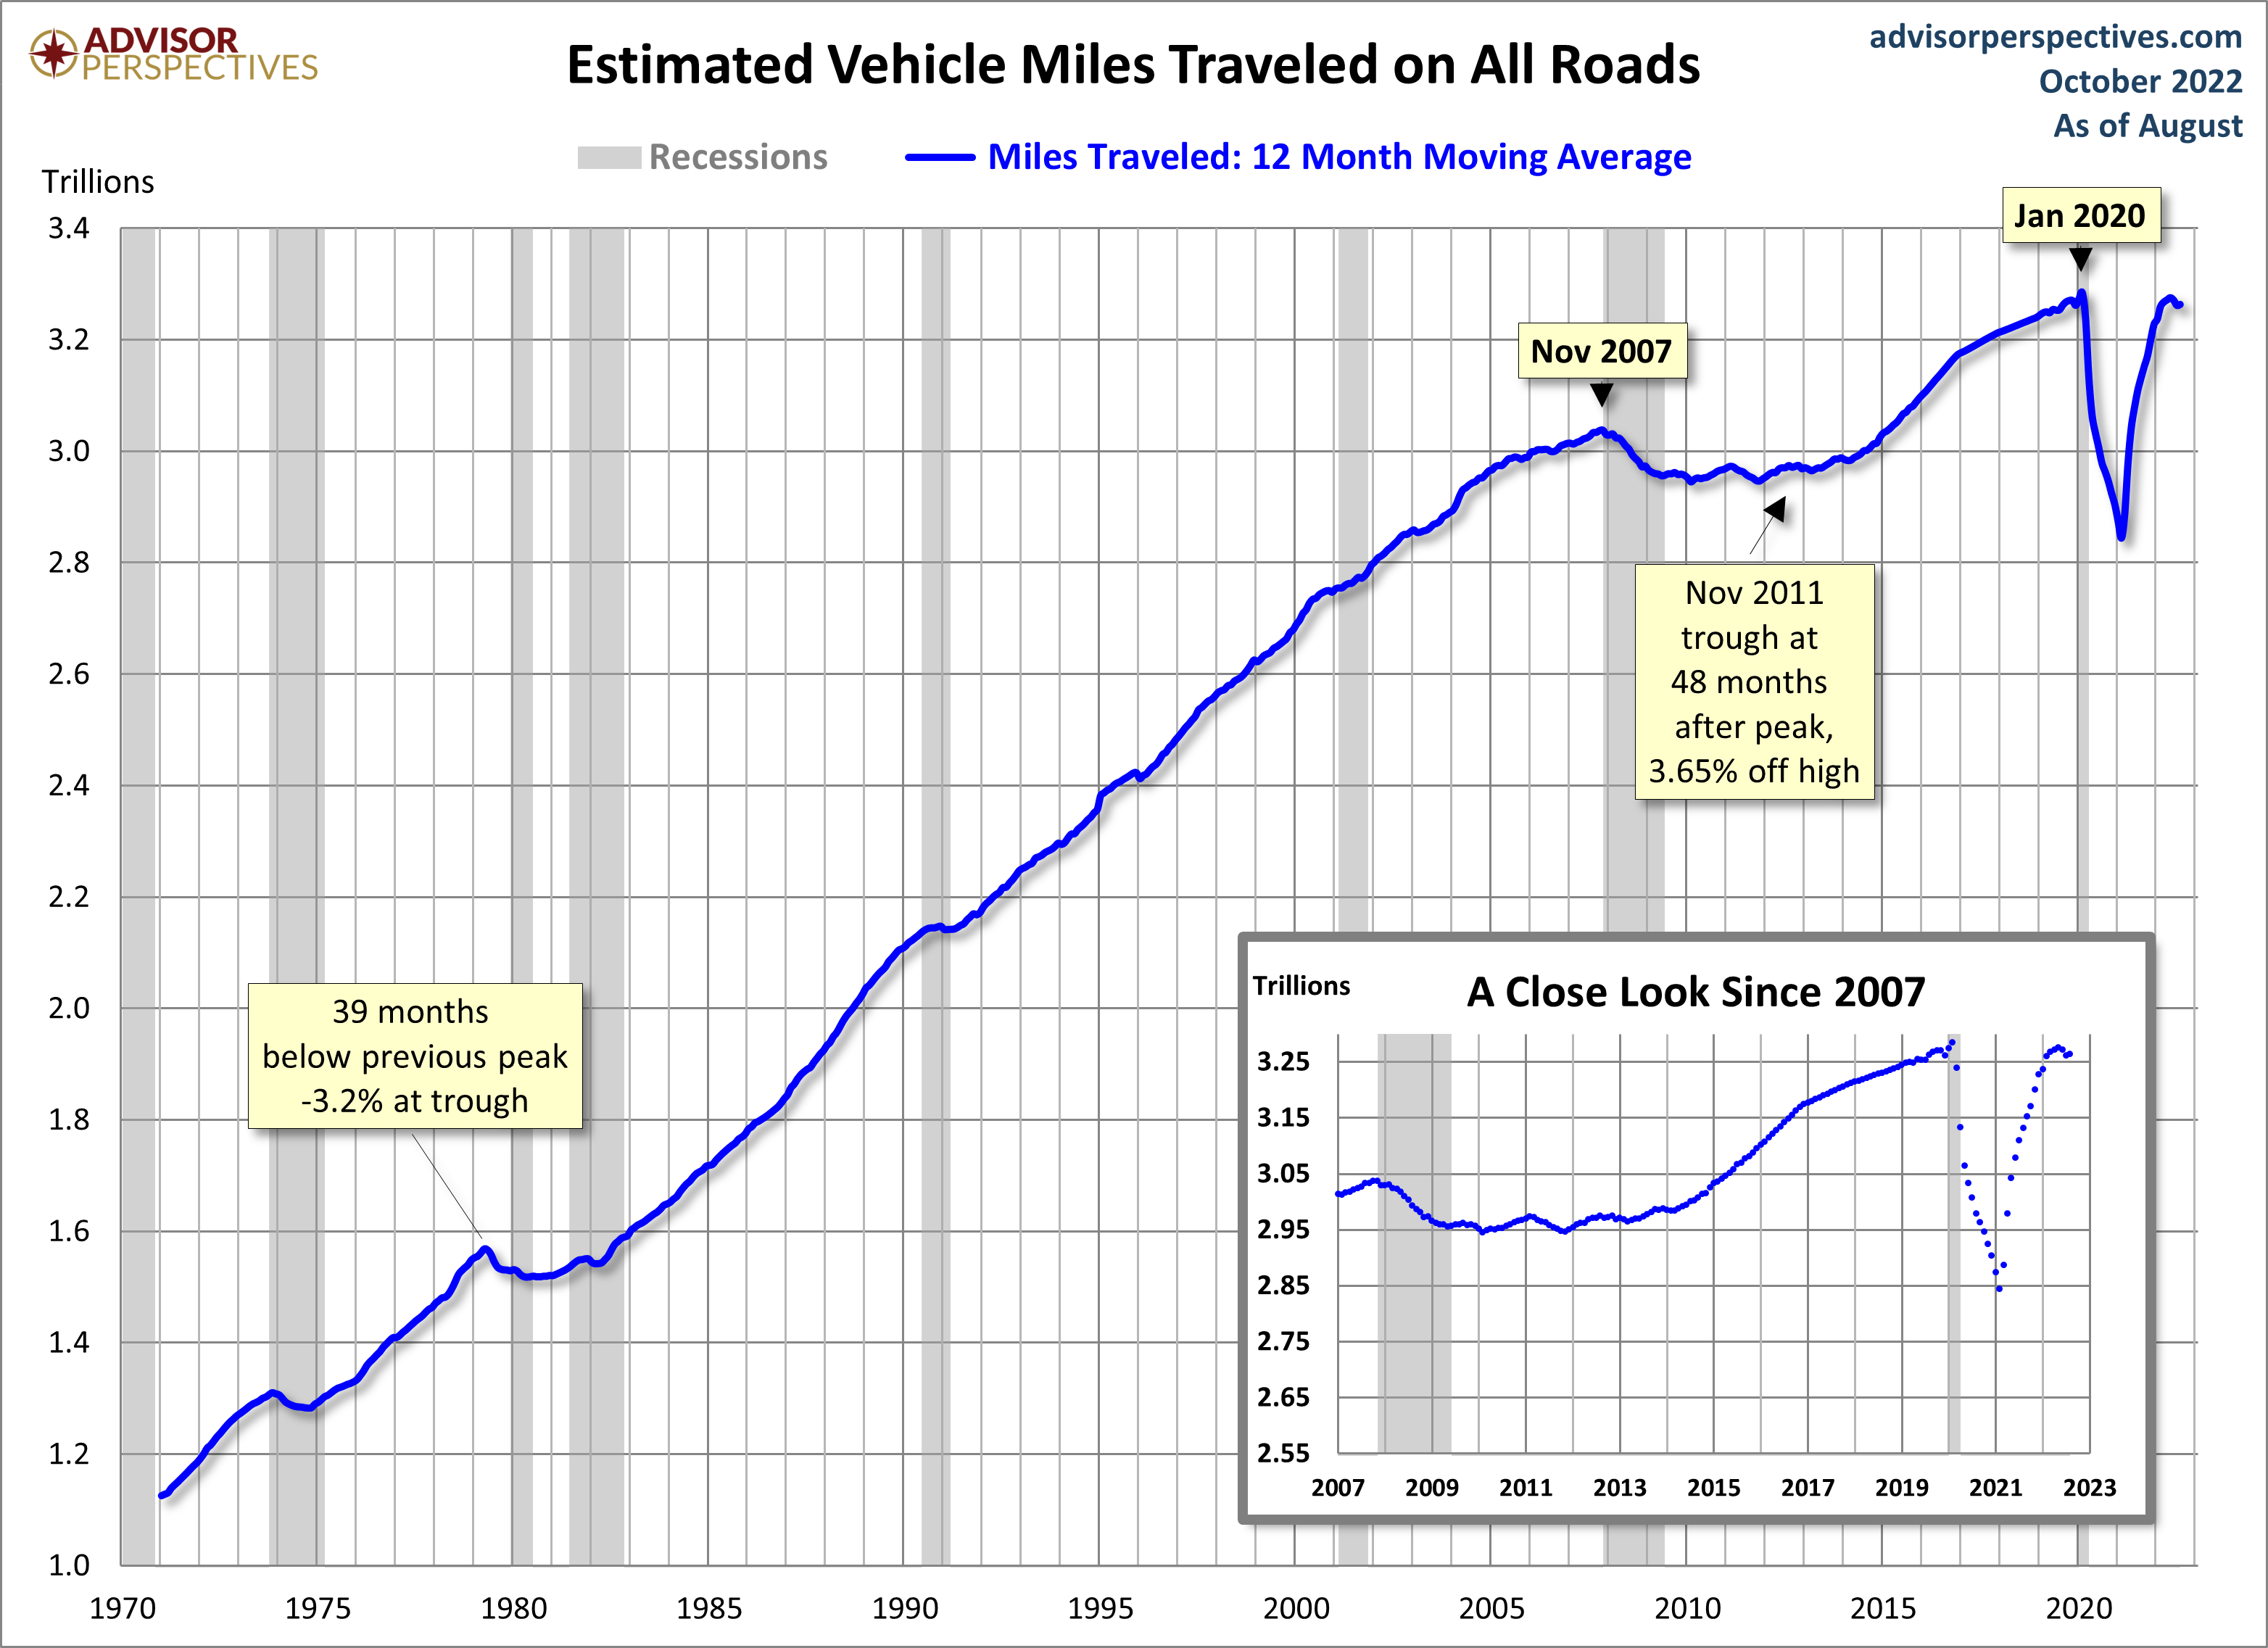
The rolling 12-month miles traveled contracted from its all-time high for 39 months during the stagflation of the late 1970s to the early 1980s, a double-dip recession era. We are currently in the most rapid decline we've ever seen, though miles traveled are still not at all-time lows, even when adjusted for population (see below).
The Population-Adjusted Reality
Total Miles Traveled, however, is one of those metrics that should be adjusted for population growth to provide the most meaningful analysis, especially if we want to understand the historical context. We can do a quick adjustment to the data using an appropriate population group as the deflator. Let's use the Bureau of Labor Statistics' Civilian Noninstitutional Population Age 16 and Over (FRED series CNP16OV). The next chart incorporates that adjustment with the growth shown on the vertical axis as the percent change from 1971.
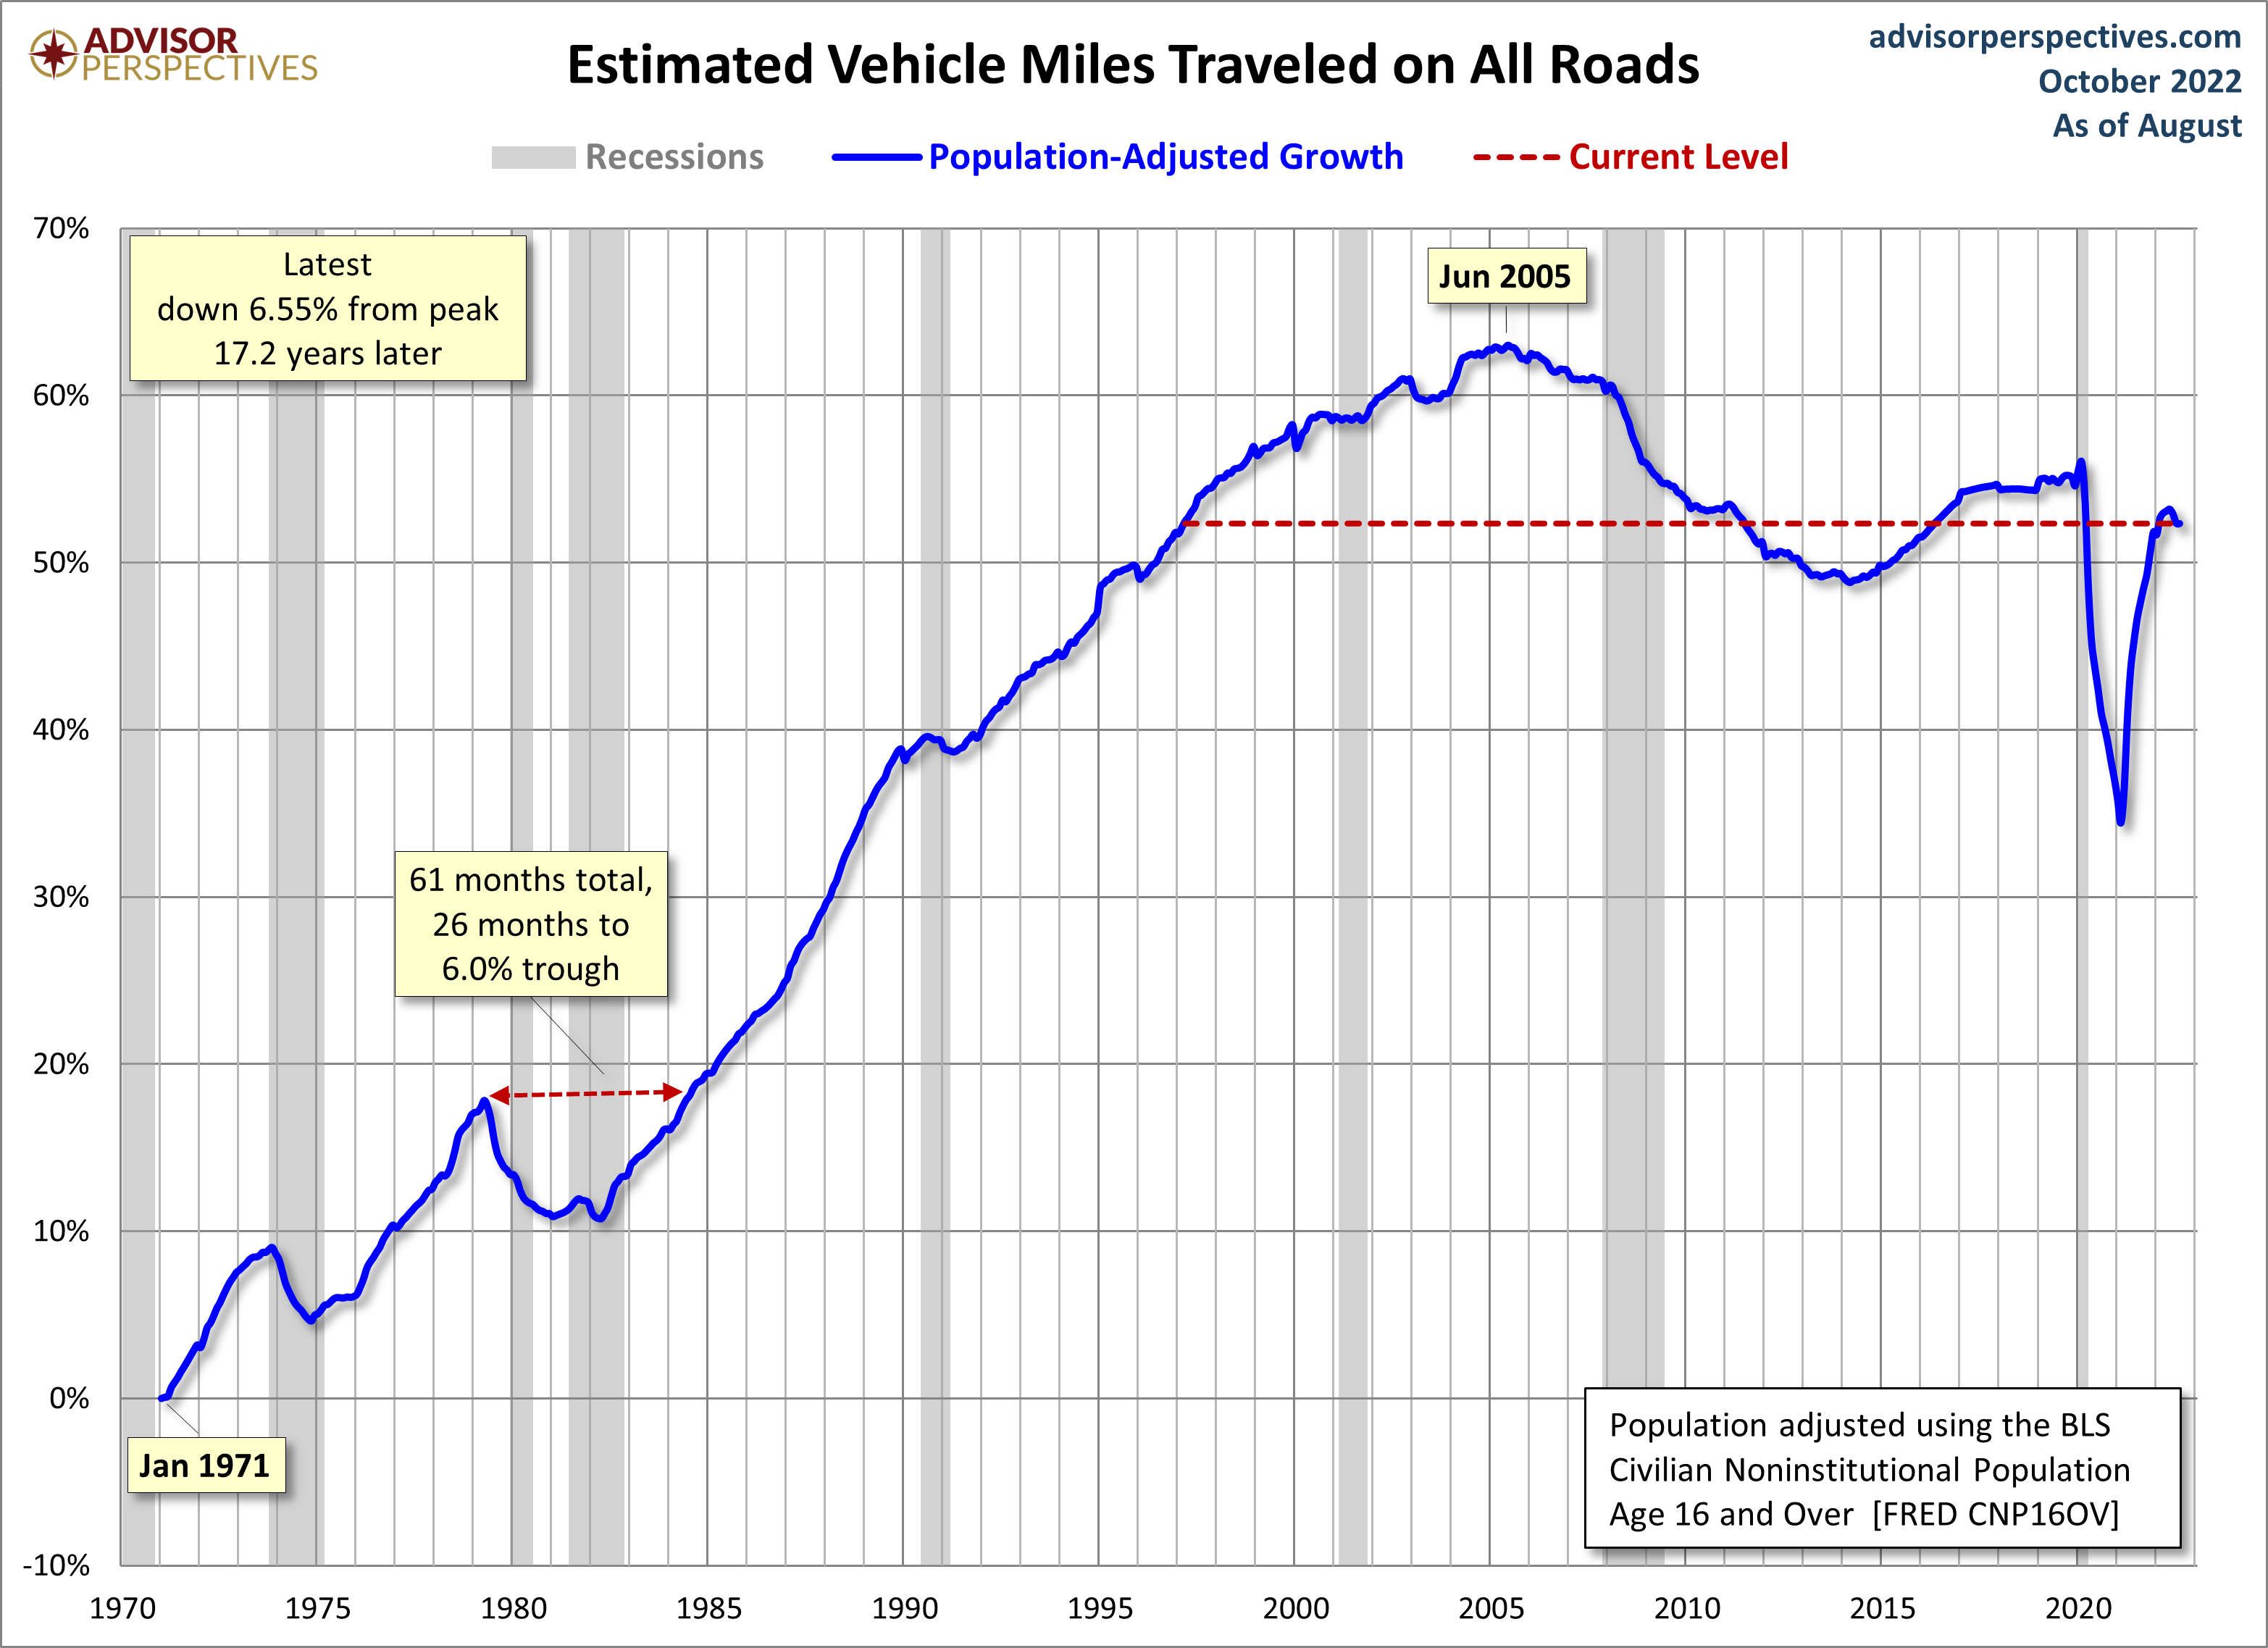
Clearly, when we adjust for population growth, the Miles-Traveled metric takes on a weaker look. The nominal 39-month dip that began in May 1979 grows to 61 months, slightly more than five years. The trough was a 6% decline from the previous peak. The COVID-19 recession has had a clear impact on driving, but has bounced back more rapidly than we've ever seen.
About that Population Adjustment…
Why use the CNP16OV data for the population adjustment? Wouldn't it make more sense to limit the population to licensed drivers? The correlation between license holders and actual drivers is far from reliable. Many license holders in households do not drive, especially in their older years. According to Census Bureau data on gasoline sales, dollars spent on gasoline peak for people in their late 40s and fall off rather quickly after that.
In fact, there's a good case for using the Census Bureau's mid-month estimates of total population (POPTHM) rather than civilians age 16 and over for the population adjustment. The reason is that a portion of the total miles traveled is specifically to support children's needs (daycare, schools, children's activities, etc.) and the needs of elders who might have licenses but no longer drive. Ultimately the division of miles traveled by either population group (CNP16OV or POPTHM), while not a perfect match with drivers, is a consistent and relevant metric for evaluating economic growth.
Here is the same population-adjusted chart, this time with the total population for the adjustment. In the total population-adjusted version, the latest data point is 2.98% off-peak. This population-adjusted version puts us at a level we first achieved in 2002.

The Role of Gasoline Prices
What about the impact of volatile gasoline prices? How much of a factor has that been in the trend? Here is an overlay of the population-adjusted miles traveled and real (inflation-adjusted) regular gasoline prices (all formulations) since the early 1990s.

In the big picture, there are profound behavioral issues apart from gasoline prices that are influencing miles traveled. These would include the demographics of an aging population in which older people drive less, continuing high unemployment, the ever-growing ability to work remotely in the era of the Internet, and the use of ever-growing communication technologies as a partial substitute for face-to-face interaction.
More By This Author:
September Inflation: The ComponentsCryptocurrencies Through Wednesday, Oct. 19
New Residential Housing Starts Down 8.1% In September


Comments
Log in or sign up to join the conversation.