
A New High In GDX Is Possible

Image Source: Pixabay
SPX Monitoring purposes; Long SPX on 9/5/24 at 5503.41.
Sold SPX on 8/19/24 at 5608.25 = Gain 8.14%gain; Long SPX on 8/5/24 at 5186.33.
Our Gain 1/1/23 to 12/31/23 SPX= 28.12%; SPX gain 23.38%
Monitoring purposes GOLD: Long GDX on 10/9/20 at 40.78.
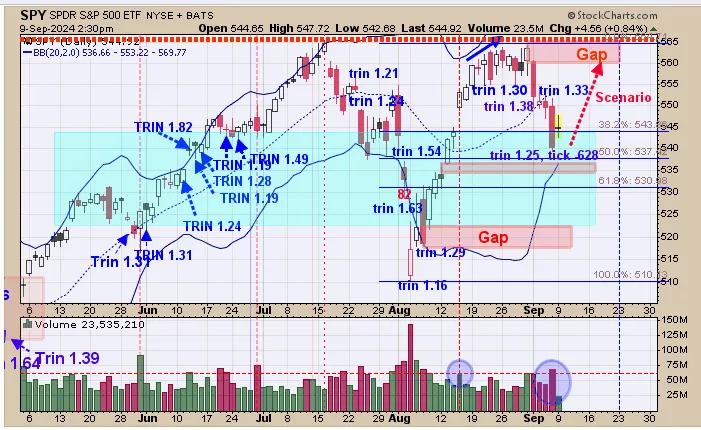
We are up over 25% this year so far; SPX is up around 14%. Above is the daily SPY. Last Friday the TRIN closed at 1.25 and the Tick closed at -628 which is a bullish combination that suggests a low will form as early as the same day to as late as two days later which would be tomorrow. It appears the low may have formed on Friday. The FOMC meeting is next Tuesday and Wednesday (September 17 and 18) and the market could rally into that date. A possible upside target is the September 3 gap near 560 SPY range. Long SPX on 9/5/24 at 5503.41.
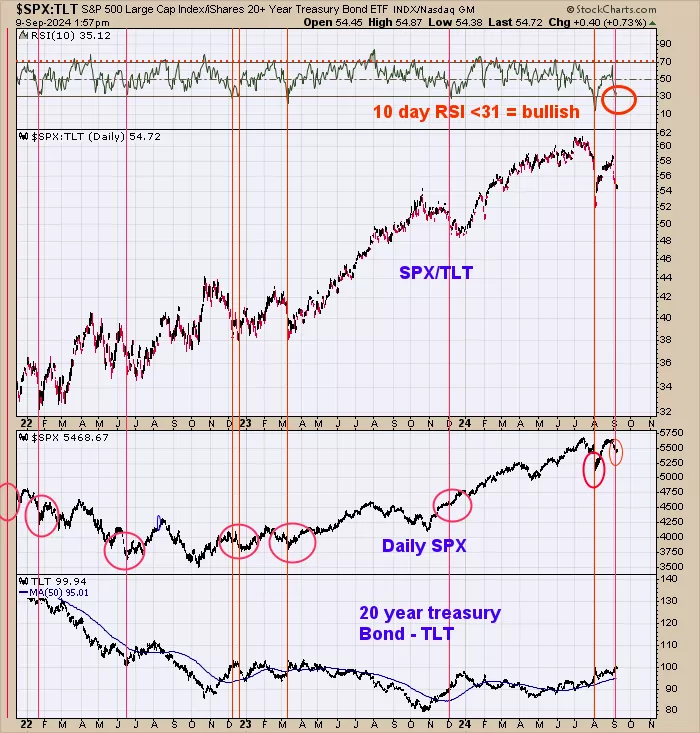
We showed this chart Friday in our short report; we updated it to today’s trading. The top window is the 10-day RSI for the SPX/TLT ratio (next lower window). Friday the RSI for this ratio closed at 30.93 and said it was bullish territory. We went back and checked the RSI readings to see where the RSI hits when it turns bullish for the market. RSI readings below 32 seem to work well. The RSI readings below 30 seem to produce the best percentage rallies. The market is mired in a trading range that may go into October. Having said that, the current SPY bounce may find resistance to the down gap from 9/3 near 560 SPY range.
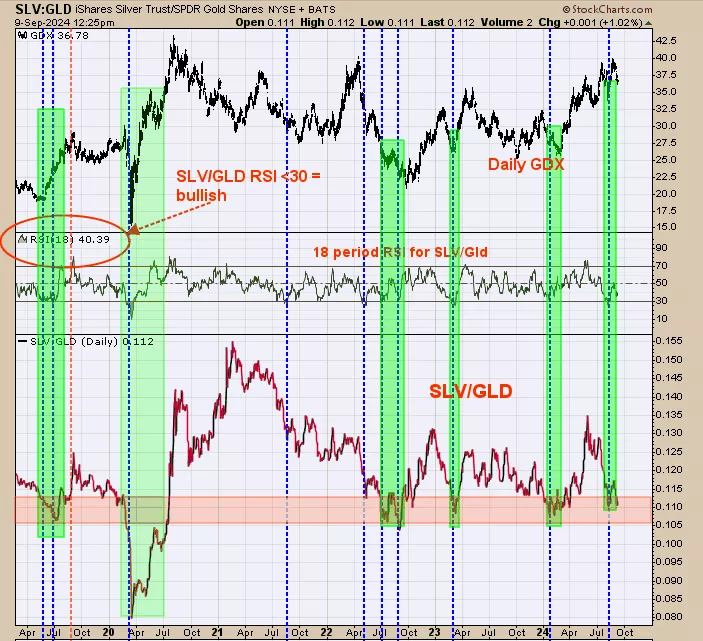
We updated this chart from last Thursday and the commentary is still relevant, “The bottom window is the SLV/GLD ratio ETF. This chart goes back to mid-2019. We shaded in light pink the times when this ratio fell below .115 range and then extended in shaded light green where the GDX price occurred (top window). It appears lows in GDX corresponded with SLV/Gld reading near .115 and below. We have been showing other indicators over the last several weeks that suggest the short-term rally in GDX is not over. A new high in GDX is possible.”
More By This Author:
The New Market AnalysisGDX Short Term View
Positive Divergence For Gold And a Pullback For SPY
Signals are provided as general information only and are not investment recommendations. You are responsible for your own investment decisions. Past performance does not guarantee future performance. ...
more

