
3 Charts That Show Gold Is Still Dirt Cheap
After updating my macro-market outlook report for subscribers, I realized something about Gold. On a historical basis, it remains incredibly cheap.
It may seem expensive on the surface, trading near $2,000/oz, but the reality is contrary to the perception.
Gold is trading around the same level as 10 years ago.

Image Source: Pixabay
Think of the gains in stocks, bonds, and real estate over the past 10 years. The SPY ETF has gained over 350%. Until a recent correction, TLT (bonds) had doubled.
Take an even wider view, and Gold looks cheaper.
Consider these examples.
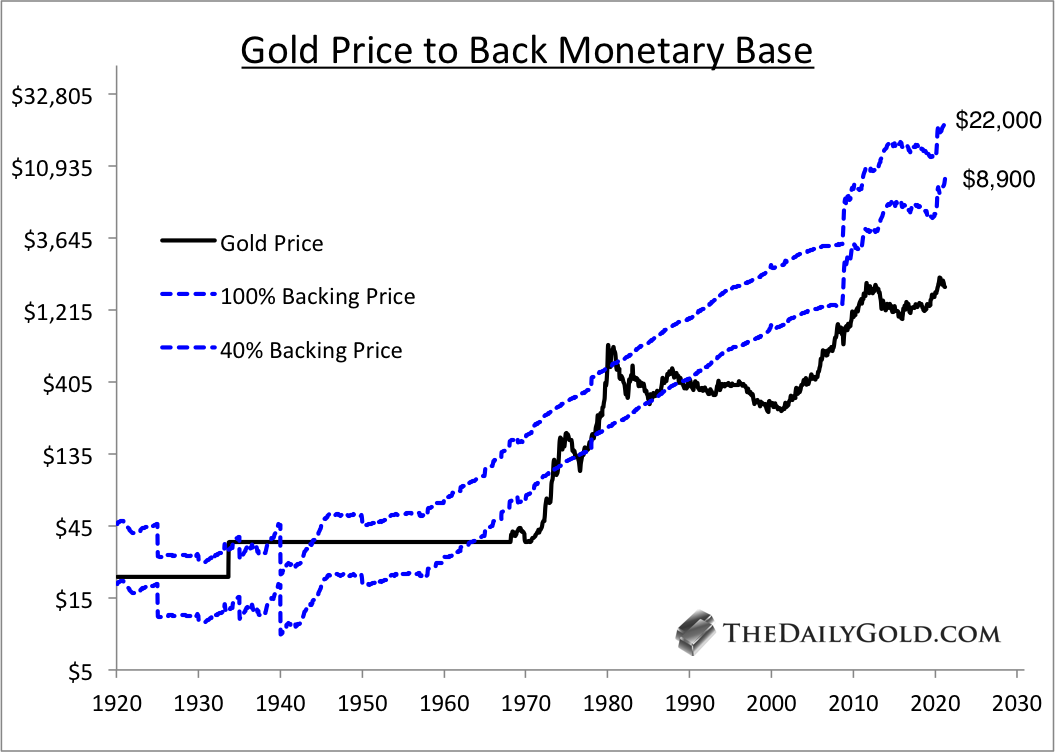
The Gold price required to back the monetary base is calculated from US gold reserves, the Gold price, and the monetary base. In the 1930s and by the end of the 1970s, the Gold price reached a level that backed 100% of the monetary base.
Today, the Gold price would need to reach $22,000 to achieve the same feat.
In 2008, which was not too long ago, the Gold price reached a 30% backing of the monetary base. For that to occur today, the Gold price would need to hit $6,700.
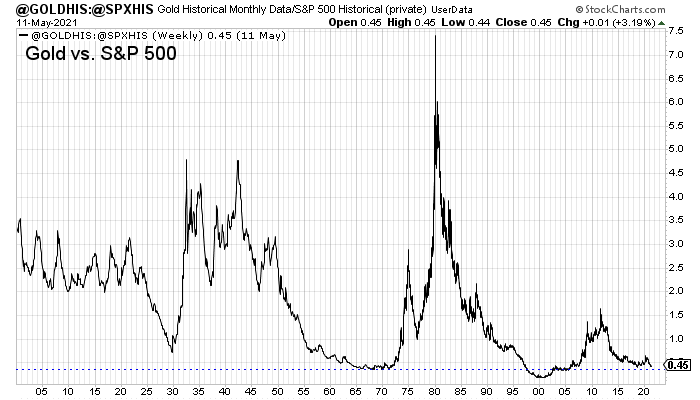
The next chart plots Gold against the S&P 500, dating back 120 years.
The ratio is currently in the 3.5% percentile. In terms of time, the ratio has spent only 9% of the past 120 years at a lower level.
The ratio has formed a big saucer bottoming pattern, and if it breaks above 0.70, it would have an upside target of 1.00. That would barely register on the chart, but it would equate to potentially $4,000 Gold.
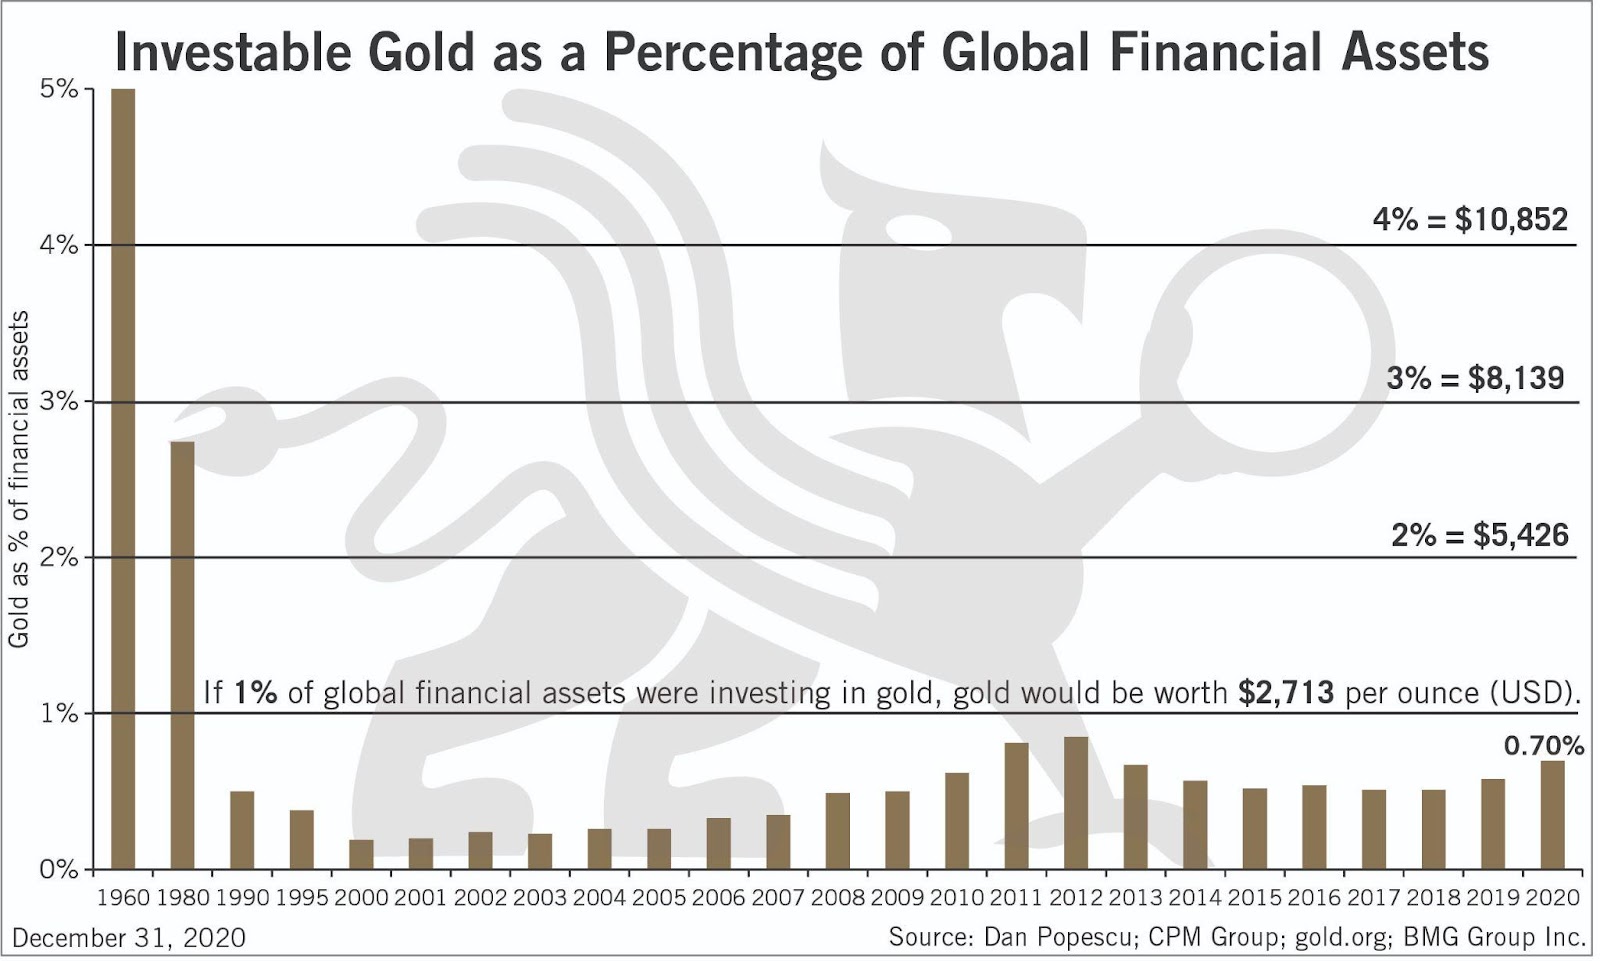
Finally, let’s look at Gold as a percentage of global financial assets.
This chart is a year old, and given the decline in Gold and continued outperformance from most other assets, the percentage is certainly lower than 0.7%.
That does not seem far from the 1980 peak of roughly 2.7% but consider the following. From 2001 to 2011, the percentage of global assets in Gold went up roughly 4x while the price gained almost twice that amount.
By the time this figure surpassed 1%, the Gold price could be trending past $4,000/oz.
(Click on image to enlarge)
This information, amongst other information, argues that the real bull market in Gold hasn’t begun yet.
Gold is currently building the handle portion of a cup and handle pattern, which we anticipate could break to the upside sometime in 2022 or early 2023. The measured upside target is $3,000/oz, but these charts argue the run could go farther.
The inflation data surpassed 4% this week, but the market believes it will fall back and settle at lower levels. When the market recognizes inflation will stick, we will see Gold outperform the stock market and trend towards a breakout.
As an investor, I’m positioning myself in the companies with the best combination of upside potential and fundamental quality. These are companies you can buy and hold for a few years that have the potential to be 5,7 and 10 baggers should Gold break past $2,100/oz.
Disclaimer: TheDailyGold.com and TheDailyGold Premium are not investment advice. The website, email newsletter and premium newsletter are ...
more

