Coal India Ltd. Indian Stocks Elliott Wave Technical Analysis - Tuesday, January 7
COAL INDIA LTD – COALINDIA (1D Chart) Elliott Wave Technical Analysis
Function: Counter Trend Lower (Minor degree, Grey)
Mode: Corrective
Structure: Potential flat
Position: A-B-C Flat might be complete
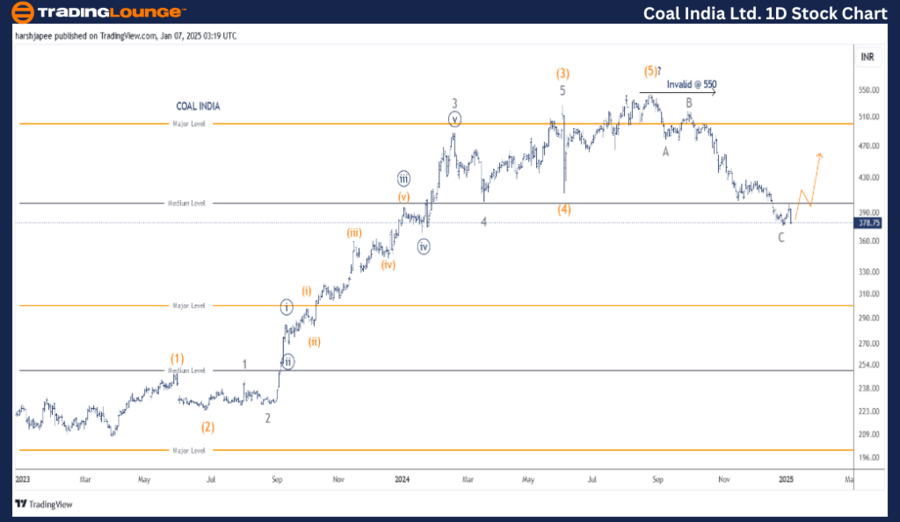
Details: A potential top is in place around 550, termination of Intermediate Wave (5) Orange. The stock has dropped towards 375 mark in three waves A-B-C. A short term rally is possible from current levels before the next leg lower resumes.
Invalidation point: 550
(Click on image to enlarge)
COAL INDIA Daily Chart Technical Analysis and potential Elliott Wave Counts:
COAL INDIA daily chart is indicating a major top in place around the 550 mark. The stock has rallied from 208 lows in March 2023 through 550 high in August 2024 as an impulse wave, terminating Wave (5) Intermediate Orange.
Furthermore, prices have sharply reversed since 550 high and dropped through 375 lows carving an A-B-C flat corrective structure. If the above holds well, the stock should resume a corrective rally soon towards 430 levels at least.
COAL INDIA LTD – COALINDIA (4H Chart) Elliott Wave Technical Analysis
Function: Counter Trend Lower (Minor degree, Grey)
Mode: Corrective
Structure: Potential flat
Position: A-B-C Flat might be complete
Details: A potential top is in place around 550, termination of Intermediate Wave (5) Orange. The stock has dropped towards 375 mark in three waves A-B-C. Minor Wave C can be clearly subdivided into five waves. If correct, a short term rally is possible from current levels before the next leg lower resumes.
Invalidation point: 550
(Click on image to enlarge)
COAL INDIA 4H Chart Technical Analysis and potential Elliott Wave Counts:
COAL INDIA 4H chart is highlighting the wave structure since the stock hit highs around 550 mark. The structure looks like a flat A-B-C (3-3-5), which is complete around 375 mark. If correct, bulls can be expected to be back from here soon.
Alternatively, if the drop continues from here, it could produce an extension or we might have to adjust counts as a potential impulse wave from 550 highs. Potential remains for a pullback from here at least, before the drop resumes.
Conclusion:
COAL INDIA is looking for a pullback rally from 375 lows, after having carved a Minor degree A-B-C flat from 550 highs.
More By This Author:
Elliott Wave Technical Analysis: XRP Ripple Crypto Price News For Tuesday, Jan 7
XAUUSD Commodity Elliott Wave Technical Analysis - Monday, January 6
Dow Jones - DJI Index Elliott Wave Technical Analysis 9
Analyst Peter Mathers TradingLounge™ Australian Financial Services Licence - AFSL 317817


.thumb.png.9d629c7fe386be1469937401d45214a4.png)


