Chart Of The Week: Is The Fed About To Fumble?

Image Source: Unsplash
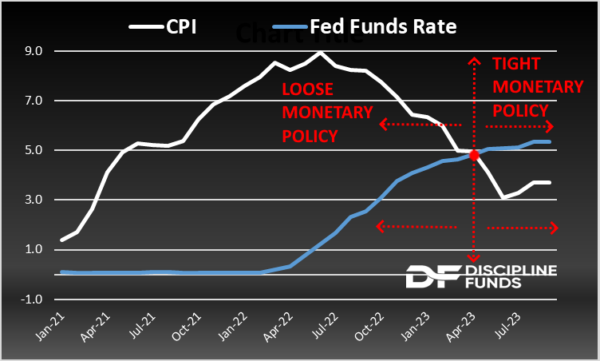
The Fed has raised rates at an unprecedented pace in the last 18 months. And while it seems like they’ve been raising rates for a long time the reality is that they were playing catch up for those first 12 months and policy finally started getting tight in the last 6 months. This can be best visualized in this chart which is a rough approximation of how loose/tight the Fed has been over the last few years.

Wednesday’s FOMC decision was interesting mainly because it was boring. It’s one of the first really unsurprising moves by the Fed. And I think that’s the right move. We’re very much in a “wait and see” mode now with policy. They’ve made a big move in a short period of time and now we get to wait and see how impactful this move will be on the broader economy.
I joined Oliver Renick on Schwab TV to discuss the move and what it might mean going forward. My big takeaways at the current time:
- The Fed made the right move here by holding rates and moving to a pause position. Inflation is moving in the right direction and some of the recent data shows substantial softening in prices and labor which warrants some caution. There are very few signs that inflation is roaring back even though it’s not coming down as fast as the Fed would like.
- The Fed has to be careful about the long end of the curve here. There’s an increasing risk that the long end will tighten too much and if it does the Fed might have to back off QT to talk the bond market down.
- The only way to judge a “soft landing” is if the Fed is able to bring rates back down on their volition. That is, if they get forced into an emergency landing then they failed. But if they ease rates back down to 2-3% on their own volition then we’ll all need to shut up and thank the Fed for doing a great job.
- The rubber is going to meet the road in 2024. Q3 GDP came in at 4.9%, but early estimates for Q4 are showing a sharp slowdown to just 1.2%. We don’t foresee a recession in 2024, but we do expect that the economy looks much more like that 1.2% figure than the 4.9% figure so it will be interesting to see if credit markets continue to slow and labor finally follows suit.
Our view is that the Fed is done or darn close to done. That could have important implications for fixed-income investors. We’ve recently communicated that the 5-year duration point is the sweet spot for the bond market, but as long rates moved higher in the last month the longer end of the curve starts to look more and more attractive. Heck, this is the first time in my career that I’ve looked at individual 10-year T-Notes and said “hmmm, I might actually buy one of those and hold it all the way to maturity”. If you’re building custom T-Bill ladders (or what our help building one) then you might consider a little longer duration in the ladders to start locking in a bit more income for a longer period.
More By This Author:
Weekend Reading – Commuting, Credit And Fumbling In The Red Zone
Chart Of The Week: Booming GDP?
Inflation Hedges, Bonds And The “This Is Fine” Economy
Disclaimer Cipher Research Ltd. is not a licensed broker, broker dealer, market maker, investment banker, investment advisor, analyst, or underwriter and is not affiliated with any. There is no ...
more


