

Image Source: Pexels
Chainlink price remains under sustained pressure after confirming multiple technical breakdowns across daily charts. Analysts point to deteriorating structure, lost trend support, and weak flow data, with downside targets clustering between $10 and $8 if selling persists.
The latest price action reflects a shift from prolonged consolidation into an acceleration phase lower. While short-term bounces remain possible, prevailing indicators continue to favor further downside unless key levels are reclaimed.
Chainlink Price Breaks Descending Channel Support
Analyst CRYPTOWZRD showed a decisive breakdown from a multi-month descending channel. Price failed to hold the lower blue trendline, which had previously acted as temporary support. This loss confirms bearish continuation after a series of lower highs and lower lows since the mid-2025 peak near $28.
Chainlink price now trades at around $12.16, reflecting exhaustion following a sharp decline. Although a short-term relief bounce remains possible, downside volume remains elevated. Analysts note that former support between $13.50 and $14.00 has flipped into resistance, limiting upside recovery attempts.
(Click on image to enlarge)
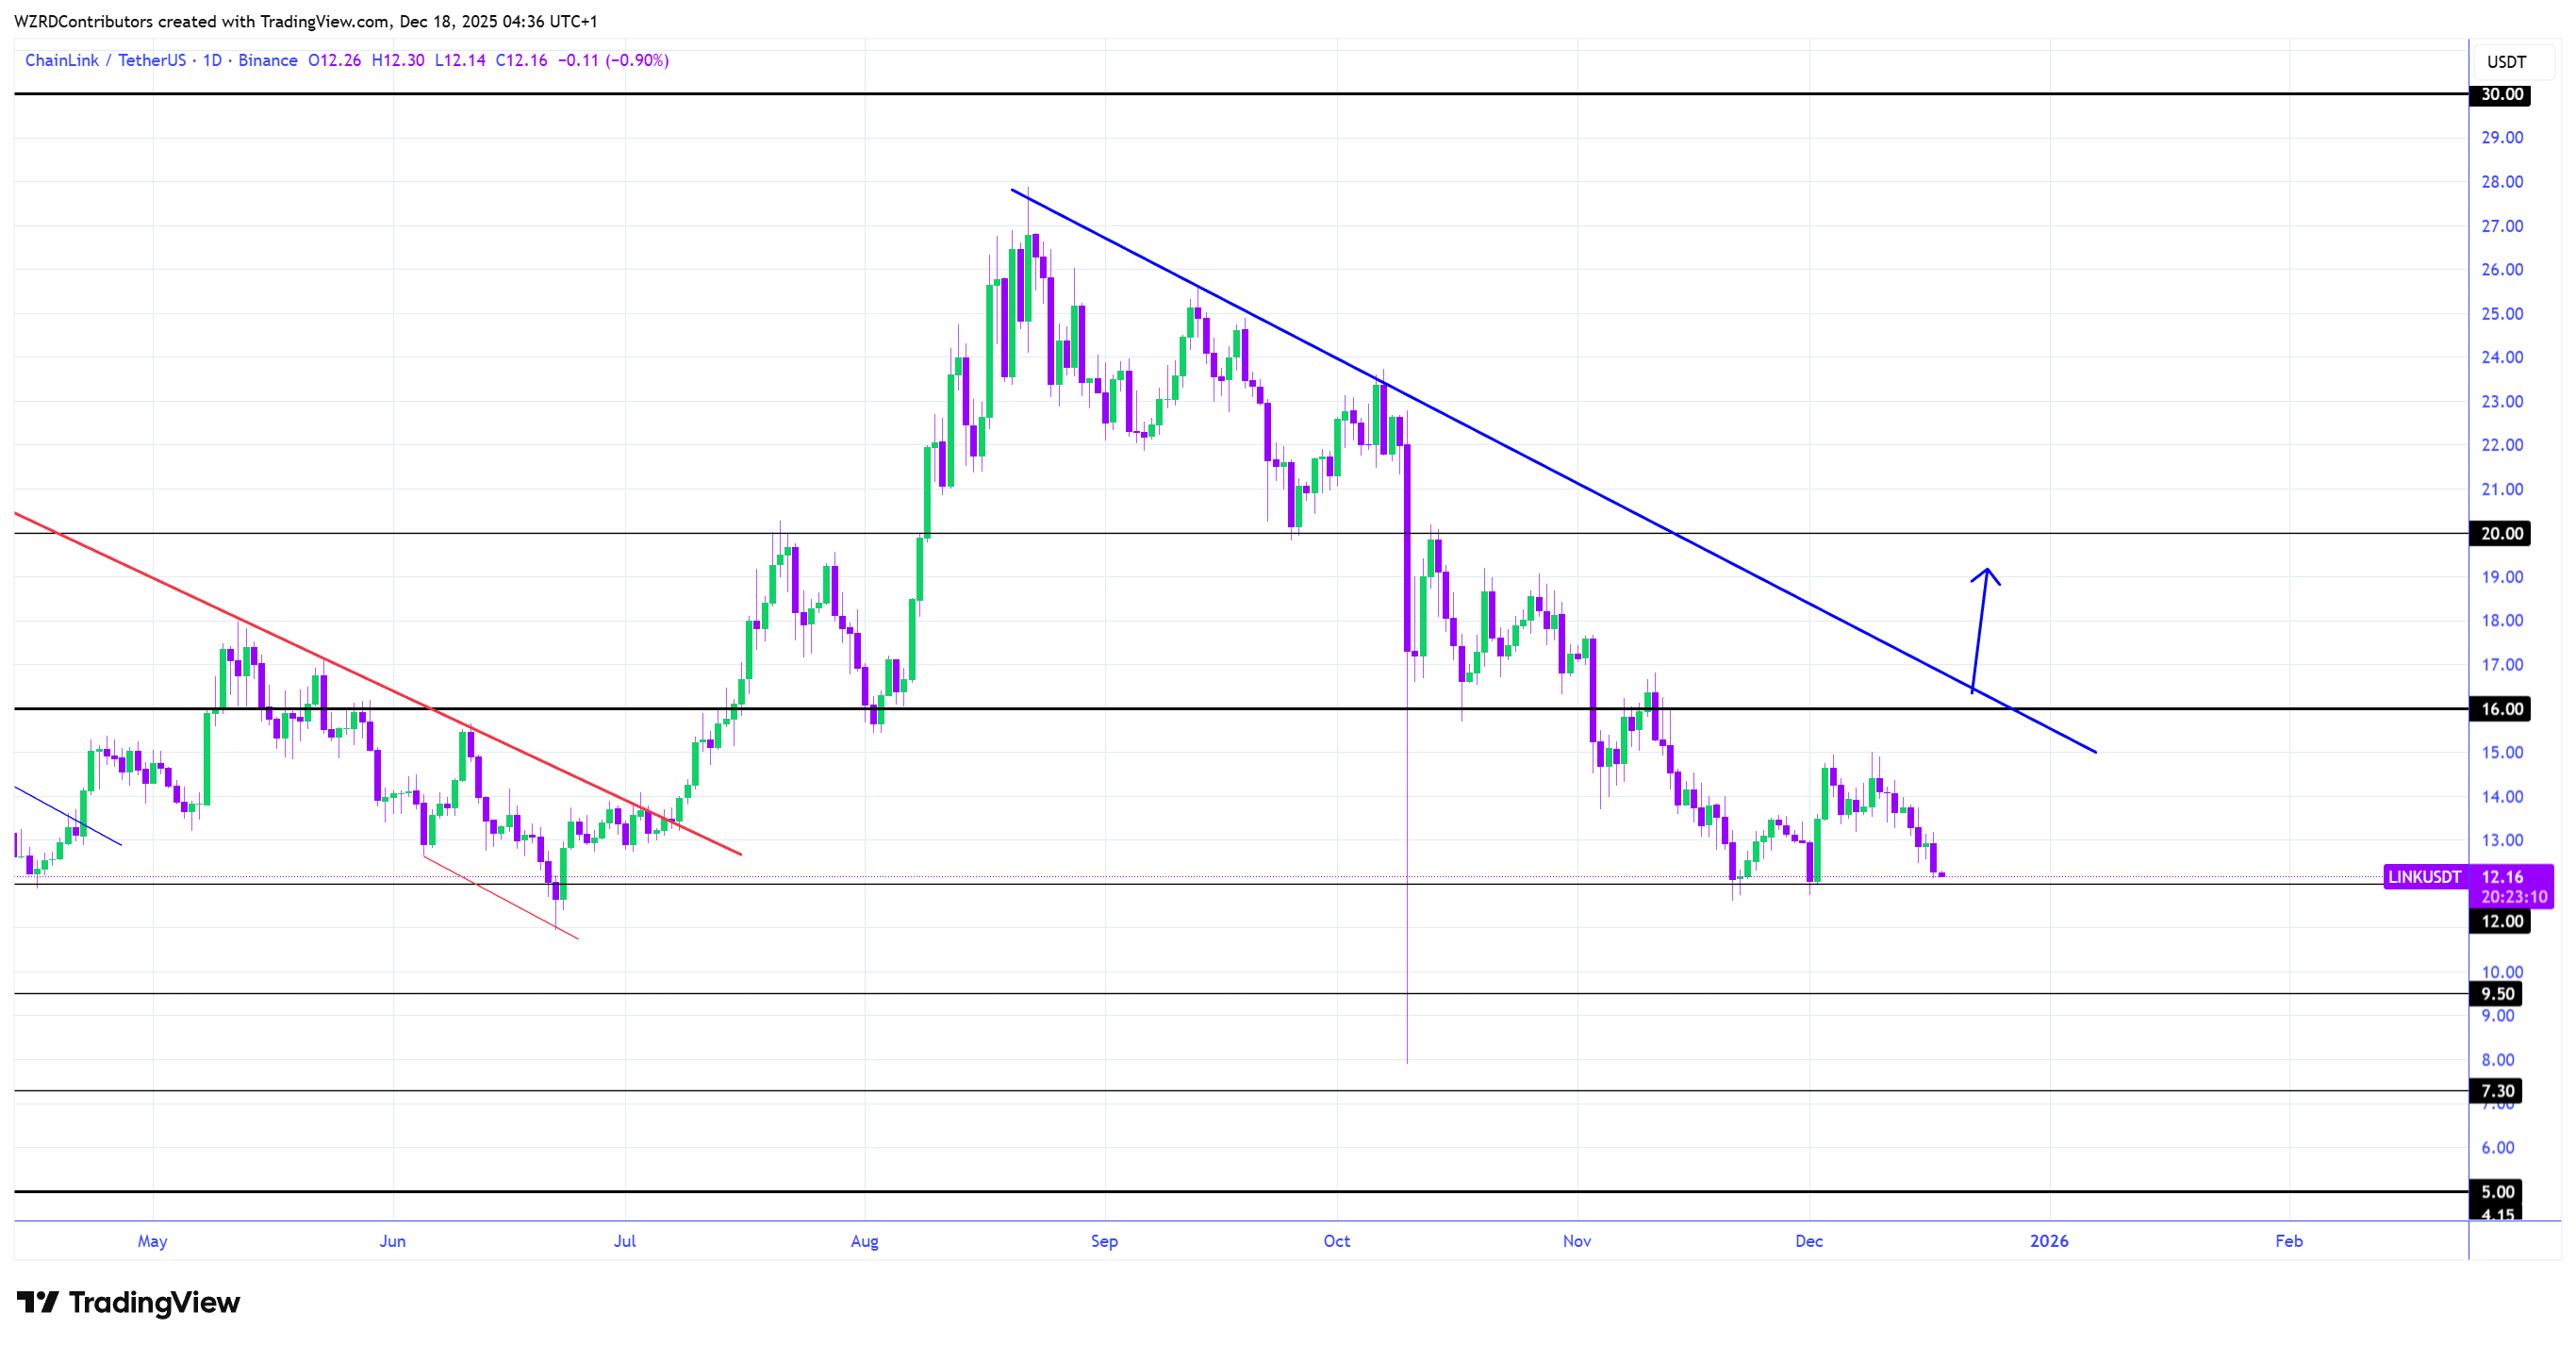
SOURCE: X
Furthermore, the broader channel projection points lower if momentum remains unchanged. Any rally toward resistance is viewed as corrective rather than trend-changing. Downside targets are placed near $10.00–$11.00 initially, with extension risk toward $8.00 if selling accelerates.
Chainlink Price Structure Shifts Bearish
Meanwhile, analyst Ali Charts highlighted the loss of a critical long-term ascending trendline that had supported Chainlink price since early 2024. Multiple failed retests weakened the structure before price finally broke down, flipping the macro trend bearish. This breakdown invalidated a multi-year bullish framework.
Price action currently hovers near $12.63, which aligns with the first projected downside level following the trendline violation. Analysts caution that failure to stabilize here could trigger cascading stop losses, accelerating declines toward $9.96 and potentially $7.73.
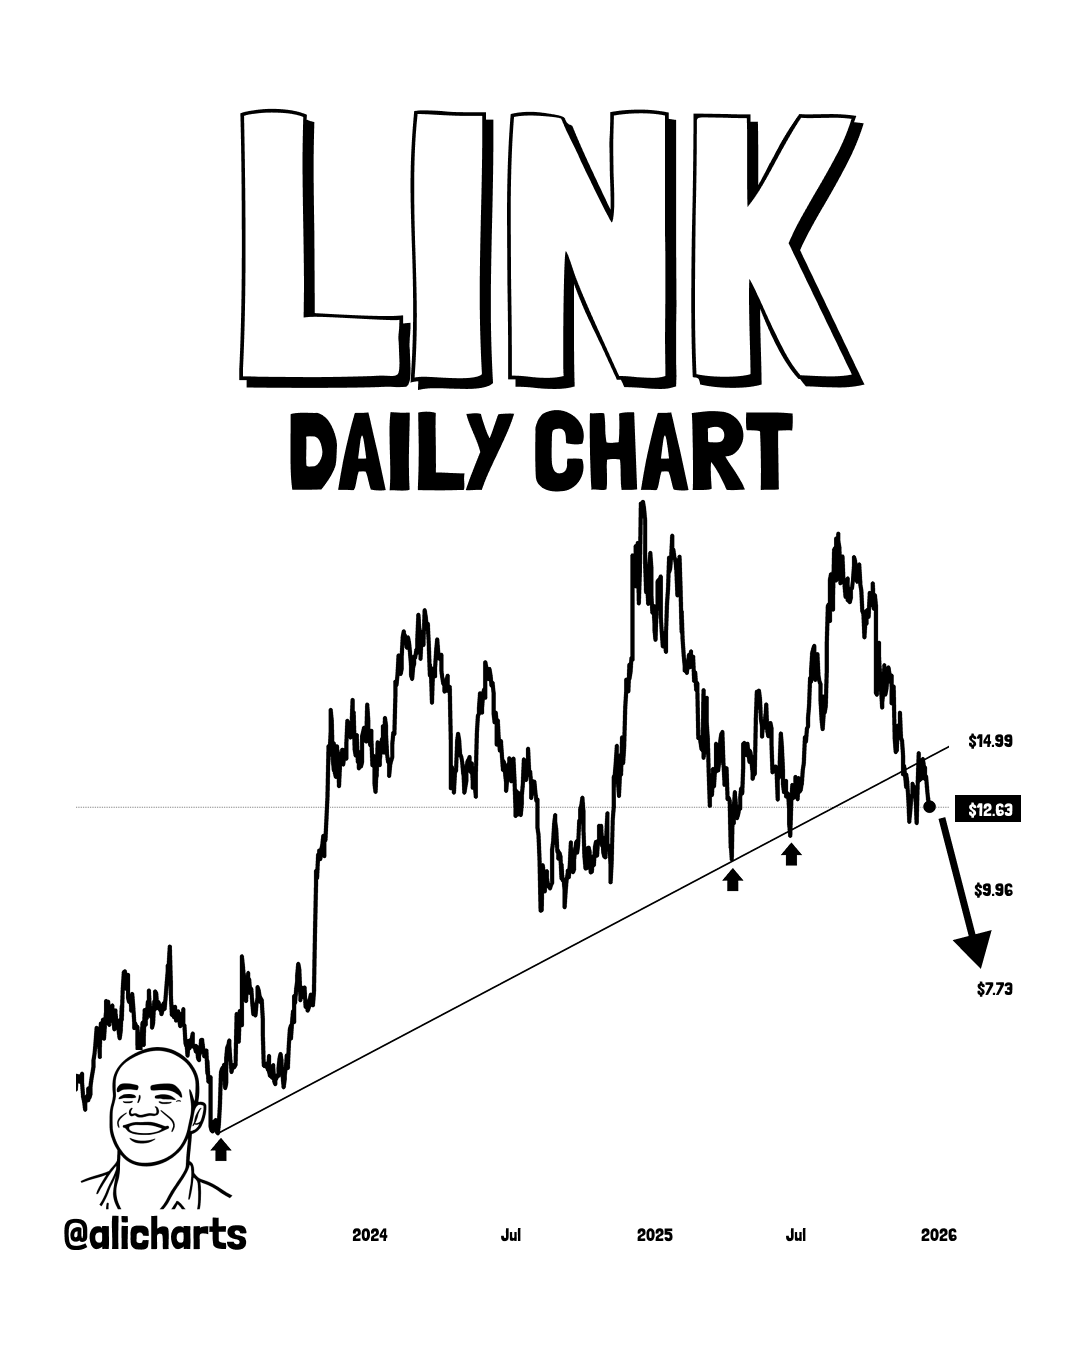
Moreover, relief rallies are viewed with caution. Unless price reclaims the broken trendline above $14.99, upside moves are likely to face selling pressure. The clean nature of the breakdown increases the probability of extended downside before meaningful accumulation emerges.
Exchange Flow Data Reinforces Bearish LINK Price Outlook
Additionally, Coinglass exchange flow data reinforces the negative technical outlook. Persistent net outflows throughout 2025 indicate holders moving LINK off exchanges, often during periods of declining confidence. Recent spikes in outflows coincided with price drops below $15.
The yellow price trend on the chart confirms weakening demand, with limited inflow responses during sell-offs. Although reduced exchange supply can limit immediate selling, the absence of sustained inflows suggests buyers remain hesitant at current levels.
Furthermore, cumulative outflows have intensified during the latest decline. This dynamic can amplify volatility if key supports break. Analysts note that meaningful stabilization may only occur near $10–$8, where on-chain clusters historically attract longer-term buyers.
Chainlink price remains at a technically fragile juncture. Until resistance is reclaimed and flow dynamics improve, downside risks toward lower support zones remain the dominant narrative.
More By This Author:
Trump Hints At Dovish Fed Stance Driving Bitcoin Rally And Rate-Cut HopesXRP ETFs Surge To $1.16 Billion With Consecutive Inflows Amid Stagnant Price
XRP Price Prediction: Ripple Token Set for $4.70 Rally On Breakout Signals


Comments
Log in or sign up to join the conversation.