BTC/USD Signal: Bitcoin’s Path Of Least Resistance Is Higher
Bitcoin's bullish path with trading strategies for rising trends. Insight into significant ETF inflows, gold's outflows, halving event anticipation, and detailed technical analysis including resistance levels, RSI, and ADX indicators.
Bullish view
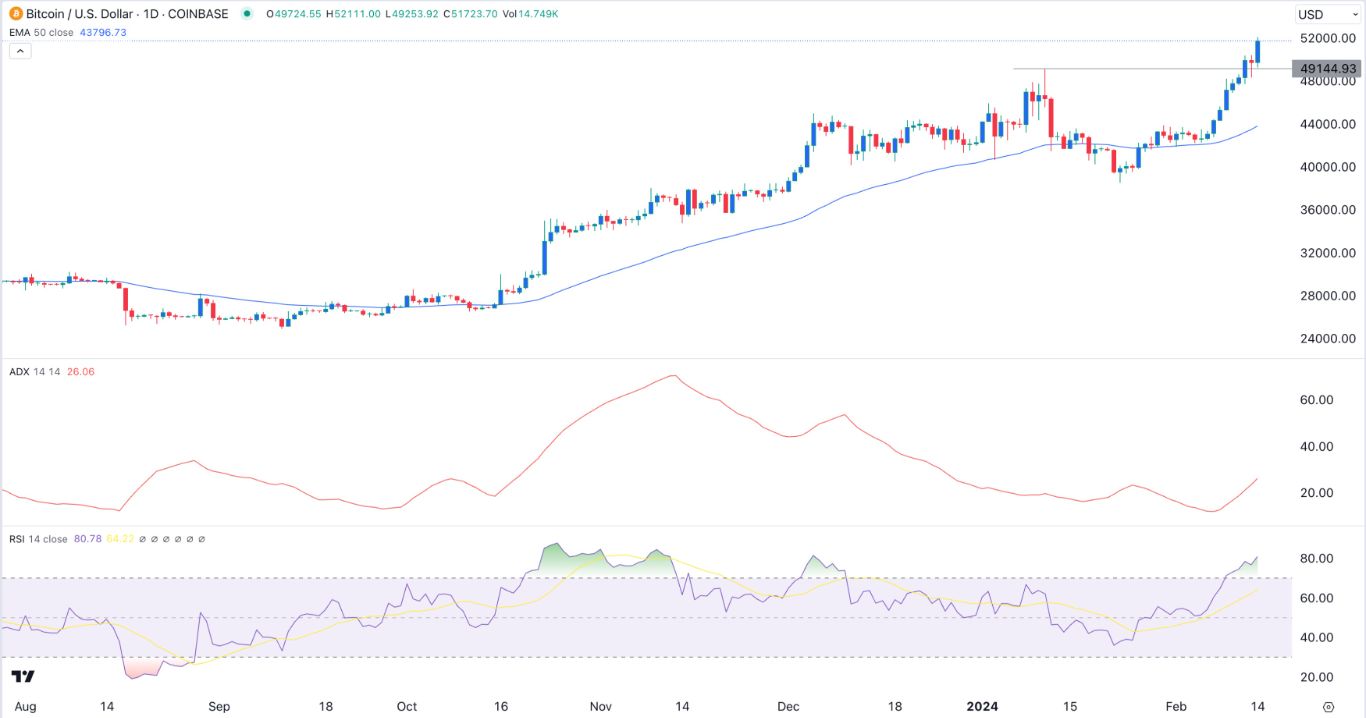
- Buy the BTC/USD pair and set a take-profit at 53,500.
- Add a stop-loss at 49,145.
- Timeline: 1-2 days.
Bearish view
- Set a sell-stop at 51,000 and a take-profit at 49,000.
- Add a stop-loss at 43,500.
(Click on image to enlarge)
Bitcoin price continued its strong bull run as the ongoing inflows in the industry continued. The BTC/USD pair soared to a high of 52,000 on Thursday, meaning that it has surged by over 34% from its lowest point in January. Other cryptocurrencies also continued rising, with the total market cap of all coins hitting almost $2 trillion.
Bitcoin ETF inflows continue
The BTC/USD pair continued its bull run as investors cheered the ongoing inflows. Data shows that popular ETFs like the iShares Bitcoin ETF (IBIT) and Fidelity Wise Bitcoin ETF (FBTC) have seen over $6 billion in inflows in the past few weeks.
Most notably, data also shows that popular gold ETFs like the iShares Gold ETF (GLD) has seen significant outflows this year. This is a sign that some investors are moving from gold to Bitcoin, which is often seen as a digital version of gold. Bitcoin has a long track record of beating gold.
More By This Author:
USD/CAD Analysis: After The Rocket Launch Higher, Near-Term ThoughtsXAUUSD Gold Price Analysis: Gold Turns Bearish As The Dollar Strengthens
EUR/USD Signal: Breaks Below The Bearish Flag Pattern
Disclosure: DailyForex will not be held liable for any loss or damage resulting from reliance on the information contained within this website including market news, analysis, trading signals ...
more


