BTC/USD Signal: Bitcoin Multi-Timeframe Analysis
Bearish view
- Sell the BTC/USD pair and set a take-profit at 38,000.
- Add a stop-loss at 41,000.
- Timeline: 1-2 days.
Bullish view
- Set a buy-stop at 40,000 and a take-profit at 41,000.
- Add a stop-loss at 38,000.
(Click on image to enlarge)
Bitcoin’s sell-off continued this week as demand continued waning. The BTC/USD pair crashed to a low of 38,550 on Wednesday morning, its lowest point since December 1st. It has retreated by over 20%, meaning it has moved to a bear market.
Bitcoin has had a harsh reversal in the past few days even after the positive regulatory trends in the United States. The Securities and Exchange Commission (SEC) accepted eleven Bitcoin ETFs earlier this month. Since then, retail and institutional investors have added over $6.5 billion in assets.
Therefore, while this was an important move, Bitcoin has pulled back as investors sell the news. In most cases, Bitcoin and other assets tend to drop after a major move or news. This happens as some investors start to take profit and as panic sellers dump the asset.
Sentiment in the crypto industry has worsened recently. The crypto fear and greed index has dropped to the neutral point of 49, down from the greed area of over 70 a few weeks ago.
There will be no major Bitcoin event on Wednesday. Therefore, the price action will likely be driven by the ongoing sentiment in the market.
BTC/USD technical analysis
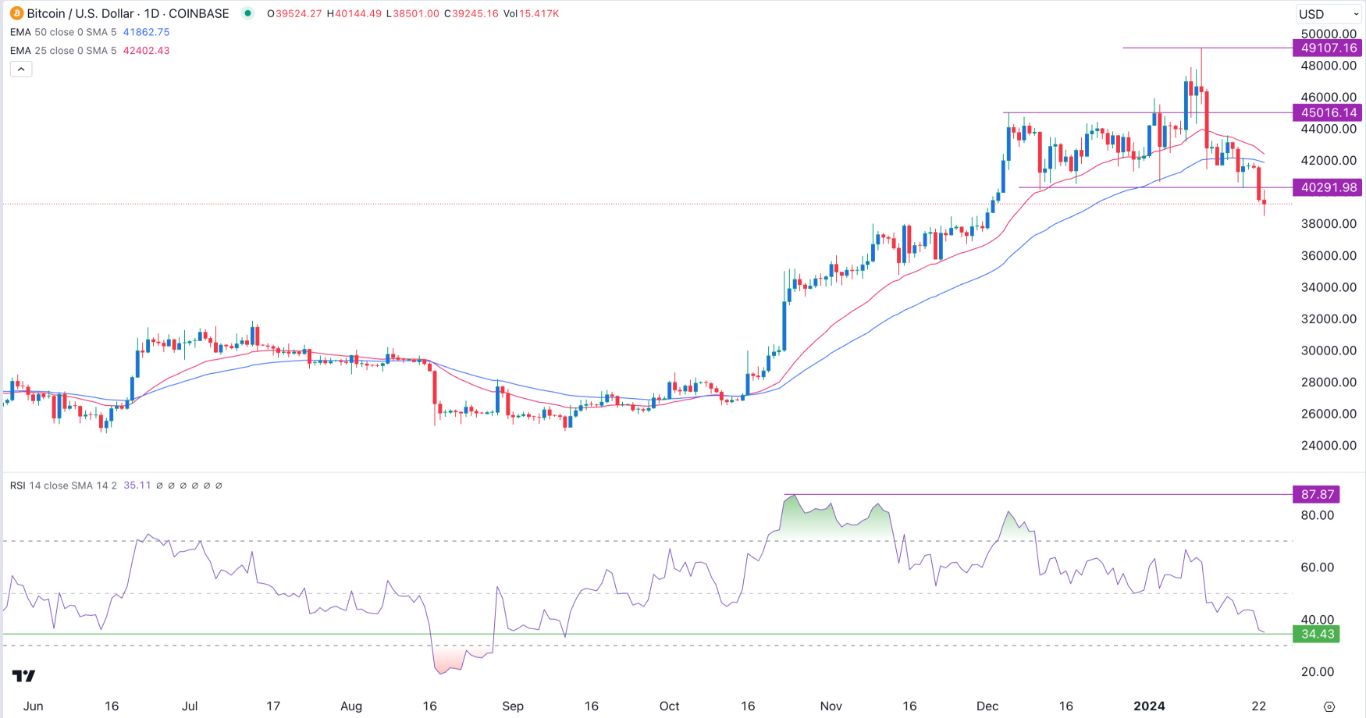
The daily chart shows that the BTC/USD pair peaked at 49,107 after the spot Bitcoin ETF approval. It has now retreated and moved below the psychological level at 49,000, signaling that bears are in control. It has also moved below the crucial support at 40,291, the lowest swing on December 11th and January 3rd.
The Relative Strength Index (RSI) has moved from October’s high of 87.87 to 34.9, the lowest point since 11th September. This means that the pair has not yet gotten oversold. Therefore, the pair will likely continue falling as sellers target the psychological point at 37,000. The stop-loss of this trade will be at 41,000.
BTC/USD 4H chart analysis
(Click on image to enlarge)
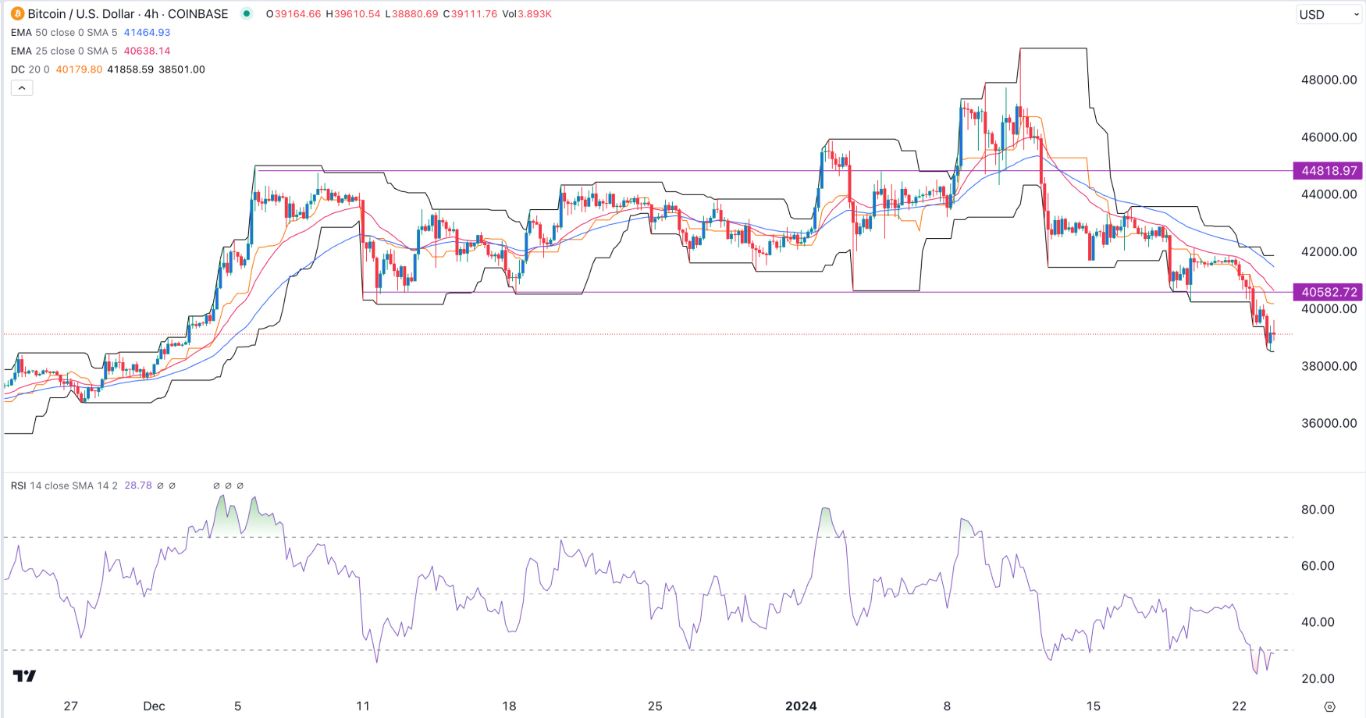
The 4H chart shows that the BTC/USD pair has been in a strong bearish trend in the past few days. It remains below the 50-period and 25–period Exponential Moving Averages (EMA). The pair has also dropped below the Ichimoku cloud and the lower side of the Donchian channels. Also, the Relative Strength Index (RSI) has moved below the oversold point.
Therefore, the pair will likely have a dead cat bounce and retest the support at 40,582 and then resume the downward trend. The stop-loss of this trade will be at 41,000.
More By This Author:
GBP/USD Analysis: The Pound Sterling Still Holding UpBank Of Japan Maintains Ultra-loose Policy, Lowers Core Inflation Forecast
BTC/USD Signal: Bitcoin Gets Extremely Oversold
Disclosure: DailyForex will not be held liable for any loss or damage resulting from reliance on the information contained within this website including market news, analysis, trading signals ...
more


