BTC/USD Signal: Bearish Pennant Pattern Points To Danger Ahead
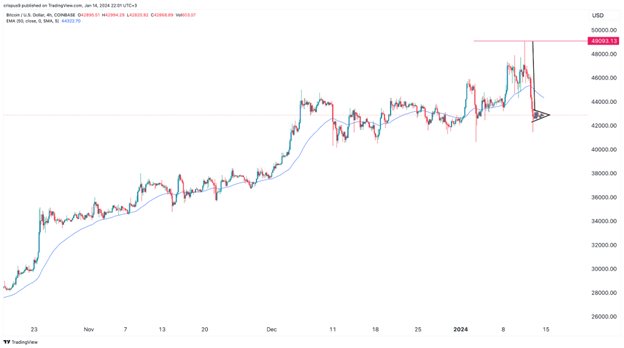
The BTC/USD pair initially jumped to 49,093 and then pulled back sharply to 41,000 as traders sold the news.
Bearish view
- Sell the BTC/USD pair and set a take-profit at 40,000.
- Add a stop-loss at 44,000.
- Timeline: 1-2 days.
Bullish view
- Set a buy-stop at 43,000 and a take-profit at 45,000.
- Add a stop-loss at 40,000.
suffered a harsh reversal after the Securities and Exchange Commission (SEC) approved eleven spot ETFs. The BTC/USD pair initially jumped to 49,093 and then pulled back sharply to 41,000 as traders sold the news. It was trading at 42,876 on Monday morning as traders waited for the next catalyst.
Selling the news
Bitcoin price surged in the past few months after financial behemoths like Blackrock, Invesco, and Fidelity launched their spot Bitcoin ETF proposals. The theory was that, because of their experience and scale, the SEC had to cave. This view accelerated after Grayscale won a major lawsuit against the SEC a few months ago.
Therefore, while the approval of a Bitcoin ETF was a positive thing, the price pulled back because the approval was already baked in by market participants. This is a situation popularly known as buying the rumor and selling the news.
Bitcoin also retreated as concerns about the Federal Reserve rose. Economic numbers published earlier this month revealed that the American economy added over 200k jobs in December as the unemployment rate remained at 3.7%. Wage growth continued to accelerate during the month.
Last week, the highly-anticipated US inflation report showed that prices remained at an elevated level in December. The headline CPI rose from 3.1% in November to 3.4% in December while core CPI dropped marginally.
Therefore, these numbers mean that the Fed will likely maintain higher rates for longer in the coming months. Prior to these reports, the consensus view was that the Federal Reserve would start cutting rates in March. This was another reason why the price of Bitcoin and other coins rose.
On a positive side, Bitcoin has another catalyst in that a halving event will happen in April. Bitcoin tends to rally sharply ahead of the halving event.
BTC/USD technical analysis
Bitcoin has retreated in the past few days as the ETF hype died. It has pulled back below the psychological level at $45,000. It has also crossed the 50-period moving average on the 4H chart.
Most importantly, Bitcoin has also formed a bearish pennant pattern, which is a popular bearish sign. This pattern is characterized by a long flag pole and a small triangle pattern. Therefore, the outlook for Bitcoin is bearish, with the next point to watch being at $40,000. In the long term, however, BTC will likely bounce back.
More By This Author:
Weekly Forex Forecast - Sunday, Jan. 14AUD/USD Forex Signal: Remains In A Tight Range Ahead Of US Inflation Data
BTC/USD Forex Signal: Stronger Bullish Wedge
Disclosure: DailyForex will not be held liable for any loss or damage resulting from reliance on the information contained within this website including market news, analysis, trading signals ...
more


