BTC/USD Forex Signal: Why Bitcoin Price Is Stuck In A Range
Bearish view
- Sell the BTC/USD pair and set a take-profit at 60,000.
- Add a stop-loss at 66,000.
- Timeline: 1-2 days.
Bullish view
- Buy the BTC/USD pair and set a take-profit at 66,000.
- Add a stop-loss at 61,000.
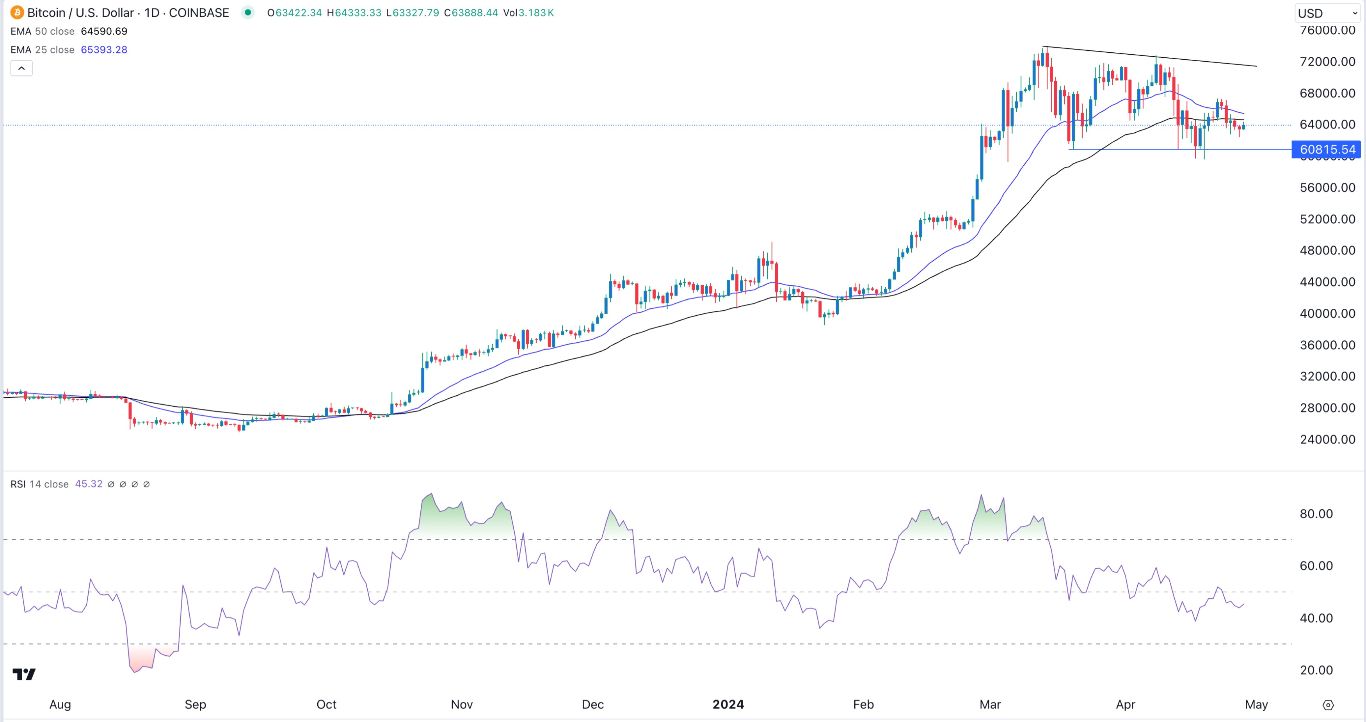
Bitcoin price remained in a consolidation phase on Monday, continuing a trend that has been going on in the past few weeks. The BTC/USD pair was trading at 63,700, where it has been stuck at since Friday. It has remained between $60,000 and $70,000 since March this year.
Bitcoin lacks a clear catalyst
Bitcoin and other cryptocurrencies have continued to consolidate in the past few weeks primarily because there have been no catalysts in the industry.
The most important catalysts have already happened this year. The Securities and Exchange Commission (SEC) has already approved spot Bitcoin ETFs, which have seen strong inflows from retail and institutional investors. These funds now have over $50 billion in assets.
The other big catalyst was the Bitcoin halving, which happens every four years. It is a process where the number of Bitcoin rewards is reduced by half. That is an important event that leads to a substantial slowdown in supply growth.
Therefore, crypto investors and traders are now waiting for the next catalyst. A key catalyst to watch will be this week’s interest rate decision by the Federal Reserve. Economists polled by Reuters expect the bank will leave interest rates unchanged.
A hawkish tone will lead to a risk-off sentiment among investors, which is a negative sign for Bitcoin, stocks, and other cryptocurrencies. There are signs that the bank will be hawkish after last week’s inflation numbers.
The headline PCE inflation figure rose to 2.6% in March while the core PCE rose to 2.8%, higher than the Fed target of 2.0%.
Bitcoin will also react to the quarterly refinancing announcement (QRA) by Janet Yellen, the head of the US Treasury. That is an important report that details the amount that the US government plans to borrow in the next three months.
BTC/USD technical analysis
The BTC/USD pair has remained in a tight range in the past few weeks. It has formed a triple-top pattern around the 70,000 level while its neckline is at 60,000. The pair’s 25-day and 50-day moving averages are about to form a bearish crossover. It is also slightly above the crucial support level at 60,815.
The Relative Strength Index (RSI) has formed a bearish divergence pattern. Therefore, the pair will likely remain in this range on Monday. The key support and resistance point to watch will be at 60,000 and 68,000.
More By This Author:
ZIM Stock Price Spikes Amid Dividend Hopes But There’s A Key Risk
AMC Stock Price Forecast: Down But Not Out
AUD/USD Forex Signal: More Upside Ahead Of US PCE Data
Disclosure: DailyForex will not be held liable for any loss or damage resulting from reliance on the information contained within this website including market news, analysis, trading signals ...
more


