BTC/USD Forex Signal: Triple Top Pattern Points To More Downside
Bearish view
- Sell the BTC/USD pair and a take-profit at 59,130.
- Add a stop-loss at 66,000.
- Timeline: 1-2 days.
Bullish view
- Set a buy-stop at 65,000 and a take-profit at 66,500.
- Add a stop-loss at 63,500.
(Click on image to enlarge)
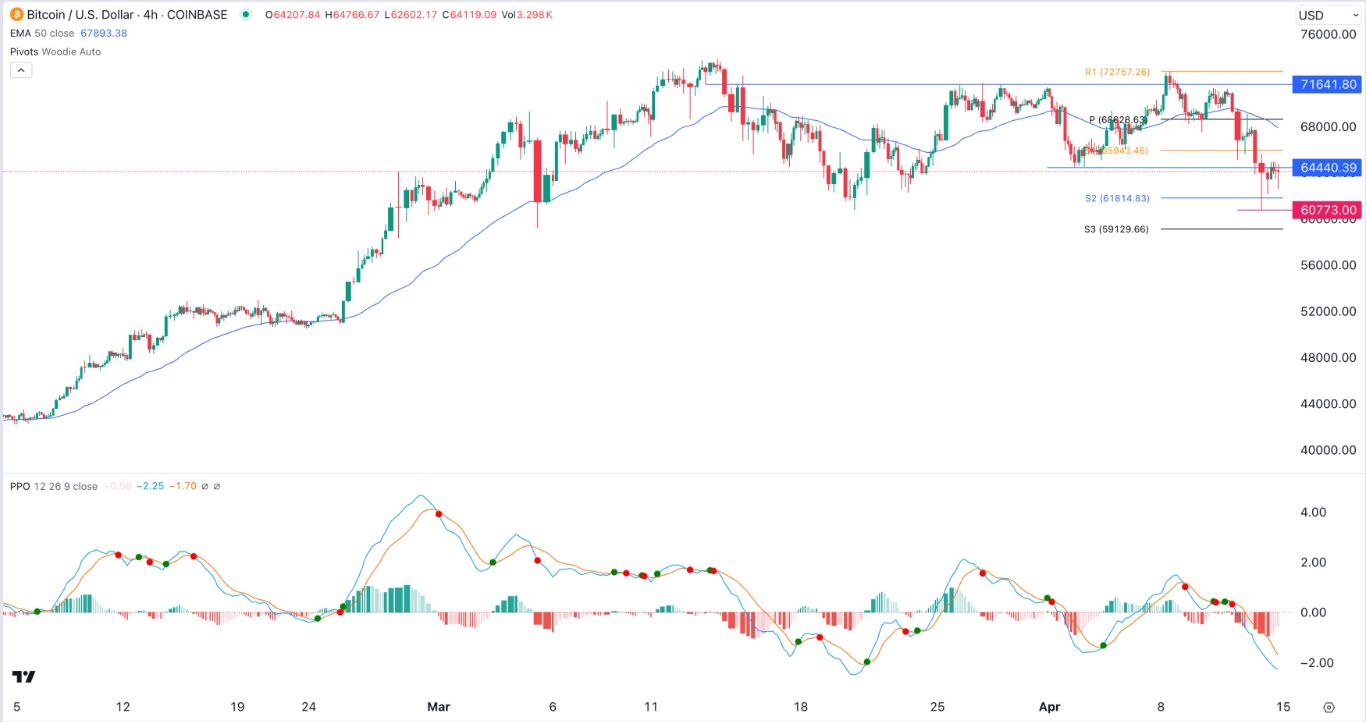
Bitcoin price had a flash crash during the weekend as traders and investors continued to take profits ahead of the upcoming halving event. The BTC/USD pair also tumbled as the market embraced a risk-off sentiment. It retreated to a low of 60,773 as bears attempted to move below the support at 60,000.
Risk-off sentiment
Bitcoin has come under a lot of pressure in the past few weeks as the enthusiasm of the halving event fades. The halving event is set to happen either late this week or early next week.
It will be an important event for Bitcoin as it will reduce the number of coins that are created every day by slashing the total rewards per block. Estimates are that over 900 coins are mined every day, a number that will drop to less than 450 after halving.
Bitcoin tends to do well ahead of the halving event, which explains why it rose from below $20,000 in 2022 to over $73,000 this year. Therefore, the ongoing pullback is likely because traders are selling the news before it happens.
Bitcoin is also falling because of the ongoing risk-off sentiment in the market. It joins other financial assets that have tumbled lately. US bonds have retreated, with the yield of the 10-year standing at 4.5% and the 30-year moving to 4.63%. Bond prices move inversely with yields.
Meanwhile, American stocks continued plunging. The Dow Jones crashed by over 490 points on Friday while the S&P 500 and the Nasdaq 100 indices retreated to 75 and 268 points, respectively. Bitcoin tends to drop when American equities are retreating.
The main driver for this move is the fear that the Federal Reserve will have a hawkish tone because of the soaring US inflation. According to the BLS, the headline consumer inflation rose to 3.5% in March while the core CPI moved to 3.8%.
BTC/USD technical analysis
The BTC/USD pair formed a triple-top pattern at 71,640. In most cases, the triple-top is one of the most popular bearish signs in the market. It has moved below the important support at 64,440, its lowest swing on April 2nd.
Bitcoin has crashed below the 50-period Exponential Moving Average (EMA) while the Percentage Price Oscillator (PPO) has moved below the neutral point. Therefore, the outlook for the pair is bearish ahead of the halving event. If this happens, the BTC/USD pair will likely retreat to the third support at 59,130.
More By This Author:
GBP/USD Forex Signal: Bears In Control As Risk-Off Sentiment PrevailsNikola Stock Price Faces These Risks In 2024
AUD/USD Forex Signal: Extremely Bullish Above 0.6645
Disclosure: DailyForex will not be held liable for any loss or damage resulting from reliance on the information contained within this website including market news, analysis, trading signals ...
more


