BTC/USD Forex Signal: Threatening Bullish Breakout
Trend lines at $29,500 looking pivotal today.
My previous BTC/USD signal last Thursday was not triggered as there was no bullish price action when the key support level at $29,344 was first reached that day.
Today’s BTC/USD Signals
Risk 0.75% per trade.
Trades must be taken prior to 5pm Tokyo time Thursday.
Long Trade Ideas
- Long entry after a bullish price action reversal on the H1 timeframe following the next touch of $29,270 or $28,810.
- Place the stop loss $100 below the local swing low.
- Adjust the stop loss to break even once the trade is $100 in profit by price.
- Remove 50% of the position as profit when the trade is $100 in profit by price and leave the remainder of the position to run.
Short Trade Ideas
- Short entry after a bearish price action reversal on the H1 timeframe following the next touch of $29,681, $29,867, or $30,092.
- Place the stop loss $100 above the local swing high.
- Adjust the stop loss to break even once the trade is $100 in profit by price.
- Remove 50% of the position as profit when the trade is $100 in profit by price and leave the remainder of the position to run.
The best method to identify a classic “price action reversal” is for an hourly candle to close, such as a pin bar, a doji, an outside or even just an engulfing candle with a higher close. You can exploit these levels or zones by watching the price action that occurs at the given levels.
BTC/USD Analysis
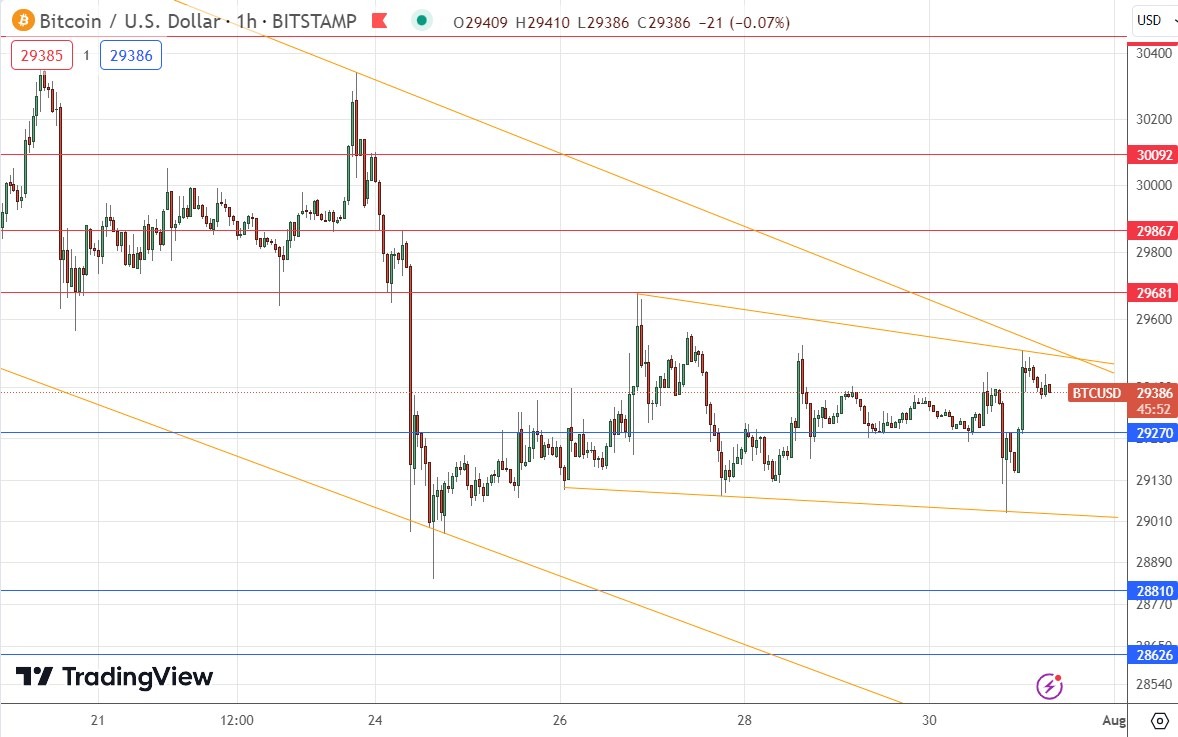
I wrote in my previous BTC/USD analysis last Thursday that it was hard to see the price going much higher despite printing pivotal higher support, as we had so many resistance levels close by, plus the upper trend line of the descending price channel, which looked very likely to keep suppressing the price.
This was a good analysis, and I was correct to look to the short side, although neither of my key resistance levels were reached that day so there was no good opportunity to enter a new short trade.
The technical picture has not changed much but it is starting to look more interesting, as we have the same long-term bearish channel holding the price down, but we have a new, shorter-term weakly bearish price channel containing the price within the larger channel.
This may be a first sign that the price is starting to get more bullish, and as the upper trend lines of these two price channels are confluent at around $29,500, a sustained breakout above that area could be a meaningful bullish sign. However, it remains difficult to see the price getting much higher, as there are several resistance levels nearby giving selling pressure, as well as the big round number at $30k and the very strong area of long-term resistance at about $31k.
For these reasons, I see the best opportunity which might set up today as a short trade from a bearish rejection of both upper trend lines of the two price channels shown in the chart below.
If instead the support level at $29,270 is reached first, this could produce a nice long scalp trade, but profits should be taken very conservatively.
(Click on image to enlarge)

There is nothing of high importance due today concerning the US Dollar.
More By This Author:
Forex Today: Asian Stocks, US Dollar RallyWeekly Forex Forecast – Nasdaq 100 Index, S&P 500 Index, EUR/USD, USD/JPY, Cocoa Futures
BTC/USD Forex Signal: Rising Within Descending Channel
Disclosure: DailyForex will not be held liable for any loss or damage resulting from reliance on the information contained within this website including market news, analysis, trading signals ...
more


