BTC/USD Forex Signal: Stuck In A Range But A Breakout Likely
Bullish view
- Buy the BTC/USD pair and set a take-profit at 63,000.
- Add a stop-loss at 56,000.
- Timeline: 1-2 days.
Bearish view
- Set a sell-stop at 58,000 and a take-profit at 55,000.
- Add a stop-loss at 63,000.
(Click on image to enlarge)
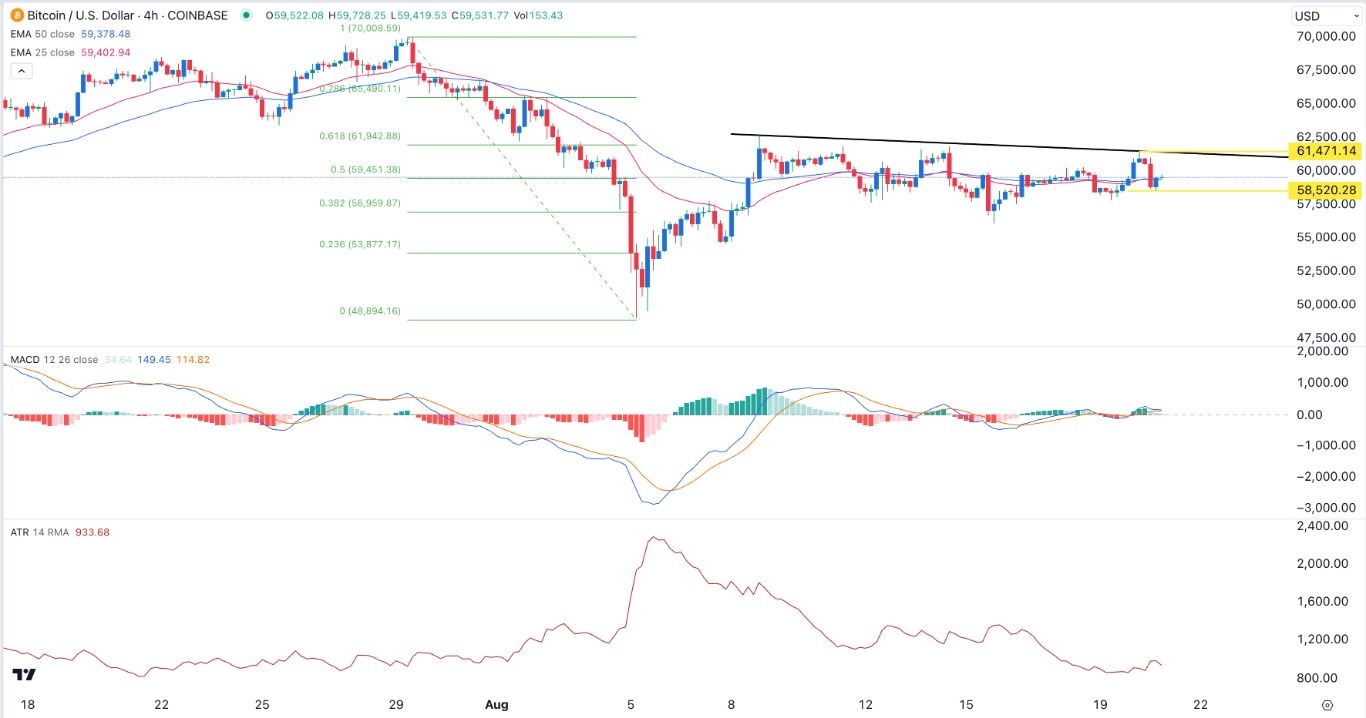
Bitcoin price made a short-lived breakout to $61,470 on Tuesday and then moved back to its previous range of 59,000. It has remained in this range in the past two weeks as some of the top catalysts have failed to lead to more demand.
Bitcoin has had several important catalysts recently. The most key one is that institutional investors have moved to the industry after spending over 15 years in the sidelines. Recent disclosures showed that tens of hedge funds have invested in spot Bitcoin ETFs.
Some of the most notable funds are the likes of Citadel, Millennium Management, Susquehanna, Renaissance Technologies, and Point72 Asset Management.
At the same time, big Wall Street banks like Goldman Sachs and Morgan Stanley have bought Bitcoin ETFs. This is a sign that the industry is gaining traction among institutions with trillions of dollars.
Bitcoin could also benefit from the ongoing gold rally. Gold has soared to a record high of over $2,500 and it could see more gains. Bitcoin is often seen as the digital version of gold and is expected to do well over time.
The key catalyst for this rally will be a confirmation by the Federal Reserve that it would consider cutting interest rates in September. Historically, Bitcoin has done well when the Fed and the central banks are cutting rates.
The bank could confirm this at the Jackson Hole Symposium in Wyoming this week. The highlight of this meeting will be a speech by Jerome Powell, the head of the bank. Estimates are that the Fed will cut rates by 0.25% in its September meeting.
BTC/USD technical analysis
The BTC/USD pair retreated to a low of 58,520 on Wednesday morning. On the 4H chart. It is hovering at the 50% Fibonacci Retracement point. It has also formed an inverse head and shoulders pattern, one of the most bullish signs in the market.
Bitcoin was consolidating at the 50-period and 25-period moving averages while the MACD indicator is hovering near the neutral point. The Average True Range (ATR) has continued falling, signaling that the pair is not volatile.
Therefore, Bitcoin will likely remain in this range and then make a bullish breakout. If this happens, the next point to watch will be at 63,000. A break below the head point at 56,100 will invalidate the bullish view.
More By This Author:
EUR/USD Forex Signal: Slowly Approaching Key Resistance At 1.1140BTC/USD Forex Signal: Inverse Head & Shoulders Forms
GBP/USD Forex Signal: Set To Retest Key Resistance At 1.3040
Disclosure: DailyForex will not be held liable for any loss or damage resulting from reliance on the information contained within this website including market news, analysis, trading signals ...
more


