BTC/USD Forex Signal: Still Rangebound As It Diverges From Stocks
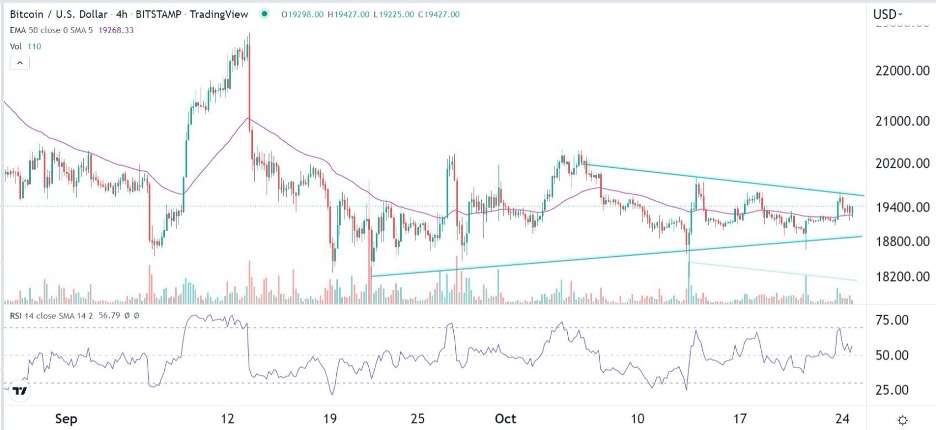
The four-hour chart shows that the BTC/USD pair has been in a consolidation phase in the past few months.
Bullish view
- Buy the BTC/USD pair and set a take-profit at 20,200.
- Add a stop-loss at 18,500.
- Timeline: 1-2 days.
Bearish view
- Set a sell-stop at 19,000 and a take-profit at 18,000.
- Add a stop-loss at 20,000.
The BTC/USD price continued consolidating this week amid a period of low volatility and volume. Bitcoin was trading at $19,500, which is slightly above this month’s low of 18,133. It has dropped by more than 15% from its highest level in September.
Bitcoin and stocks divergence
Bitcoin has moved sideways in the past few weeks amid a lack of a catalyst in the cryptocurrency industry. The only major catalyst happened in September when the Ethereum merge happened. Since then, Bitcoin and other cryptocurrency prices have remained in a consolidation phase.
The BTC/USD pair has moved sideways even as American stocks bounce back. The Dow Jones index has risen by more than 10% from its lowest level this month. Similarly, the Nasdaq 100 index has jumped by more than 8% from its lowest point this month. As a result, these indices are having their best month since 2020.
Stocks have done well this month as investors react to the ongoing earnings season. Banks like JP Morgan, Bank of America, and Goldman Sachs published relatively strong results helped by the rising interest rates.
Historically, Bitcoin and stocks have had a close correlation, which has faded recently. For example, while Bitcoin continued consolidating on Monday, the Dow Jones index rose by more than 1%.
Similarly, the inverse relationship that exists between Bitcoin and the US dollar has also eased recently. The US dollar index pulled back from last month’s high of $115 to about $112. In the past, that price movement would have been positive for Bitcoin.
Meanwhile, on-chain data shows that the hash rate has pulled back in the past few days. After soaring to a high of 266 TH/S last month, the hash rate has declined to 258 TH/s. A high hash rate is usually a sign that the network is safe.
BTC/USD forecast
The four-hour chart shows that the BTC/USD pair has been in a consolidation phase in the past few months. It is trading at the 50-day moving average and the standard pivot point. The Relative Strength Index (RSI) has moved to the neutral level of 50.
The pair has also formed a symmetrical triangle pattern that has more room to run. Volume remains significantly lower. Therefore, the pair will likely remain in this range on Tuesday. The key support and resistance levels will be at 18,500 and 20,500.
(Click on image to enlarge)

More By This Author:
XAU/USD Technical Analysis: Rebounding As The Dollar's Gains StopUSD/JPY Technical Analysis: Reacting To Japanese Intervention In The Markets
AUD/USD Forex Signal: Aussie Sell-Off Still Underway
Disclosure: DailyForex will not be held liable for any loss or damage resulting from reliance on the information contained within this website including market news, analysis, trading signals ...
more


