BTC/USD Forex Signal: Small Bearish Rising Wedge Pattern Forms
Bearish view
- Sell the BTC/USD pair and set a take-profit at 26,400.
- Add a stop-loss at 27,580.
- Timeline: 1-2 days.
Bullish view
- Set a buy-stop at 27,000 and a take-profit at 28,000.
- Add a stop-loss at 26,000.
The BTC/USD pair remained in a consolidation phase in the past few days as investors waited for the next key catalyst. Bitcoin price was trading at $26,928, where it has remained stuck since Thursday last week. This price is much lower than the year-to-date high of 32,200.
Latest Bitcoin news
The BTC/USD pair was in a tight range on Monday even after positive news in the United States. In a statement, the Securities and Exchange Commission (SEC) said that it will not appeal the Grayscale lawsuit.
The Grayscale lawsuit forced the SEC to reconsider the company’s conversion of the Grayscale Bitcoin Trust (GBTC) into an ETF. GBTC is the biggest Bitcoin fund in the world, with over $15 billion.
Grayscale hopes to change the fund into an ETF in a bid to reduce its discount to the Net Asset Value (NAV). The discount to NAV has recovered modestly in the past few months and currently stands at -15.87%, higher than the year-to-date low of -43%. This is a sign that many investors believe that the SEC will finally approve the ETF.
In addition to Grayscale, the Securities and Exchange Commission (SEC) is considering ETF proposals by companies like Blackrock, Invesco, Fidelity, and Franklin Templeton. An ETF approval will be a positive thing for Bitcoin because it will lead to more inflows from institutional investors
Bitcoin has also remained steady in the past few days even as the war in Israel continues. The war is leading to rising concerns about inflation if it continues escalating in the coming months. This will happen only if other countries in the Middle East like Iran join the conflict.
If this happens, there is a likelihood that inflation will remain at an elevated level in the next few months. High inflation will lead to a more hawkish Federal Reserve.
BTC/USD technical analysis
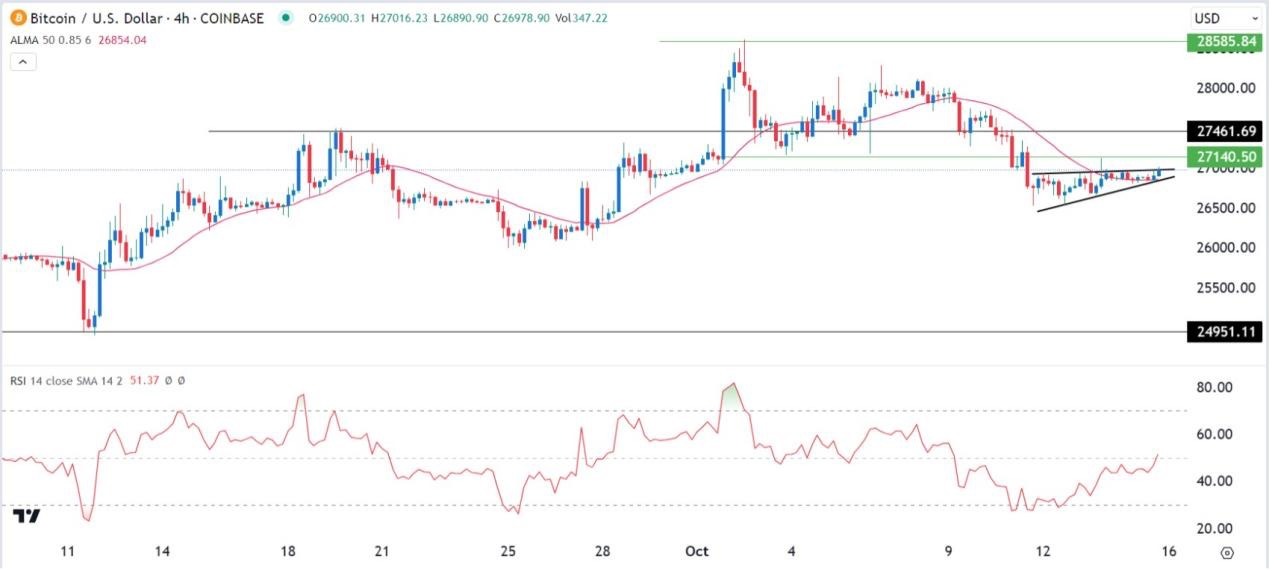
The BTC/USD pair has moved sideways in the past few days. It has remained below the psychological level of 27,000 since October 11th. It has remained below the key resistance at 27,140, the lowest level since October 13th.
Bitcoin is also consolidating at the 50-period Arnaud Legoux Moving Average (ALMA) while the Relative Strength Index (RSI) has drifted upwards. It has also formed a rising wedge pattern, which is usually a bearish sign.
Therefore, there is a likelihood that Bitcoin will continue falling as sellers target the key support at 26,500. The stop-loss of this trade will be at 27,460.
(Click on image to enlarge)

More By This Author:
Weekly Forex Forecast - Sunday, Oct. 15Trading Support And Resistance - Sunday, Oct. 15
US Inflation Rate Holds Steady At 3.7%, Core inflation Falls To 4.1%
Disclosure: DailyForex will not be held liable for any loss or damage resulting from reliance on the information contained within this website including market news, analysis, trading signals ...
more


