BTC/USD Forex Signal: Slanted Bearish Head & Shoulders Chart Pattern
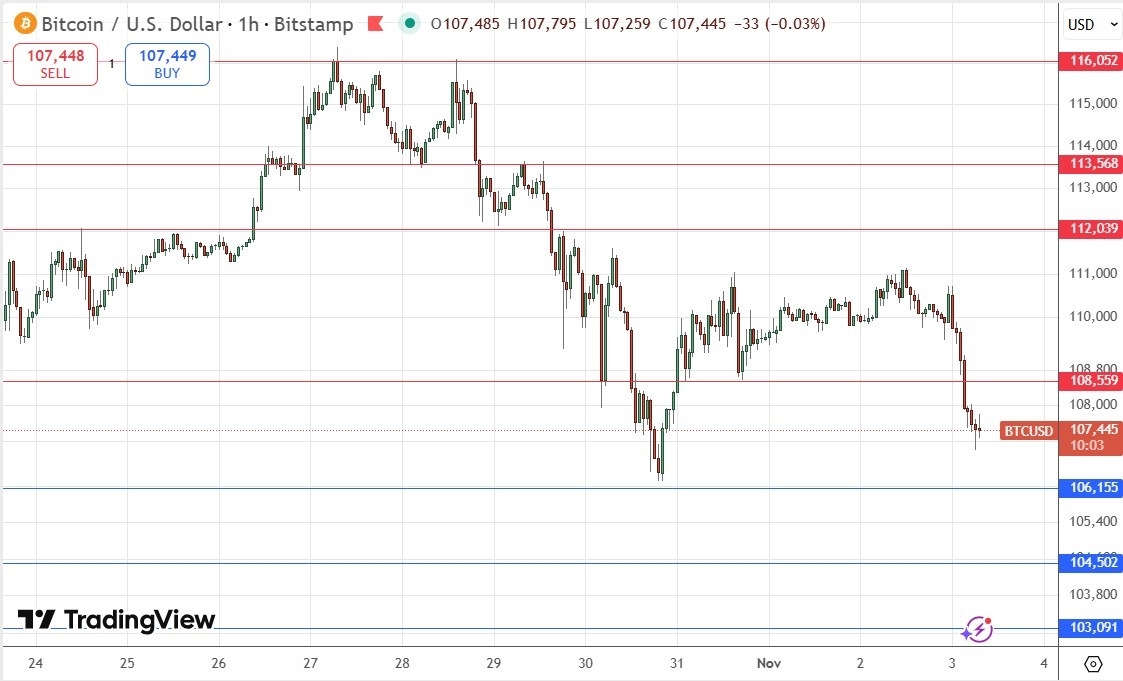
My previous BTC/USD signal on 27th October produced a profitable short trade following the bearish rejection of the resistance level at $116,016.
(Click on image to enlarge)

Today’s BTC/USD Signals
Risk 0.50% per trade.
Trades may only be taken prior to 5pm Tokyo time Tuesday.
Long Trade Ideas
- Long entry after a bullish price action reversal on the H1 timeframe following the next touch of $106,155, $104,502, or $103,091.
- Put the stop loss $100 below the local swing low.
- Move the stop loss to break even once the trade is $100 in profit by price.
- Take off 50% of the position as profit when the trade is $100 in profit by price and leave the remainder of the position to run.
Short Trade Ideas
- Short entry after a bullish price action reversal on the H1 timeframe following the next touch of $108,559, $112,039, or $113,568.
- Put the stop loss $100 above the local swing high.
- Move the stop loss to break even once the trade is $100 in profit by price.
- Take off 50% of the position as profit when the trade is $100 in profit by price and leave the remainder of the position to run.
The best method to identify a classic “price action reversal” is for an hourly candle to close, such as a pin bar, a doji, an outside or even just an engulfing candle with a higher close. You can exploit these levels or zones by watching the price action that occurs at the given levels.
BTC/USD Analysis
In my last BTC/USD forecast exactly one week ago, I thought that the best approach here was to look for a short trade with the price retreating from $116,016 which was an excellent and profitable call.
I think the technical picture now looks more bearish, with the price chart currently dominated by a slanted bearish head and shoulders chart pattern. Although many purists rejected slanted patterns, I think they can be even more bearish as they show a collapse in the most recent price action.
I call the effective neckline – the line in the sand which must be broken to allow a deeper breakdown – at the support level of $106,155. This is likely to be today’s pivotal point. If the price gets established below this level, it will be near a 4-month low price and will have the space technically to fall further.
A short trade entry below $106,155 is what I am looking for today, but I am not optimistic it will set up today.
Alternatively, a short trade from a rejection of $108,559 might also be a good trade and is more likely to set up.
Another reason beyond the technical situation to be bearish on Bitcoin is that for quite a while now, it has been obviously underperforming other risky assets. This is a bearish sign.
There is nothing of high importance due today regarding Bitcoin. Concerning the US Dollar, there will be a release of ISM Manufacturing PMI data at 3pm London time.
More By This Author:
The Best Undervalued Stocks To Buy NowThe Best Oil Stocks To Buy Now - Sunday, Nov. 2
Constellation Energy Stock Signal: Should You Sell Before Earnings?
Risk Disclaimer: DailyForex will not be held liable for any loss or damage resulting from reliance on the information contained within this website including market news, analysis, trading signals ...
more


