BTC/USD Forex Signal: Rising Wedge Points To A Pullback
Bearish view
- Sell the BTC/USD pair and set a take-profit at 110,000.
- Add a stop-loss at 120,000.
- Timeline: 1-2 days.
Bullish view
- Buy the BTC/USD pair and set a take-profit at 120,000.
- Add a stop-loss at 110,000.
(Click on image to enlarge)
Bitcoin price was little changed on Thursday morning, hours after the Federal Reserve slashed interest rates as most analysts were expecting. The BTC/USD pair was trading at 116,000, where it has been at in the past few days.
Bitcoin Wavers After the Fed Cut
The BTC/USD pair remained unchanged even after the Fed slashed rates for the first time this year. In a statement, Jerome Powell, the Fed Chair, noted that the labor market was no longer solid, citing the recent economic numbers, which showed that the country created just 22,000 jobs in August.
At the same time, the closely-watched dot plot hinted that officials expect more interest rate cuts in the coming meetings to stimulate the economy. What is unclear, however, is whether these cuts will lead to more jobs as companies are primarily concerned about Donald Trump's tariffs.
Demand for Bitcoin is still rising in the United States. Data shows that investors are still accumulating spot BTC ETFs have had inflows in the past eight consecutive days, bringing the cumulative inflows to $57.38 billion.
BlackRock's IBIT ETF has crossed the $90 billion in assets, making it one of the fastest growing funds ever. Fidelity’s FBTC ETF now holds about $24 billion, while the total Bitcoin ETFs are worth over $153 billion.
BTC/USD Technical Analysis
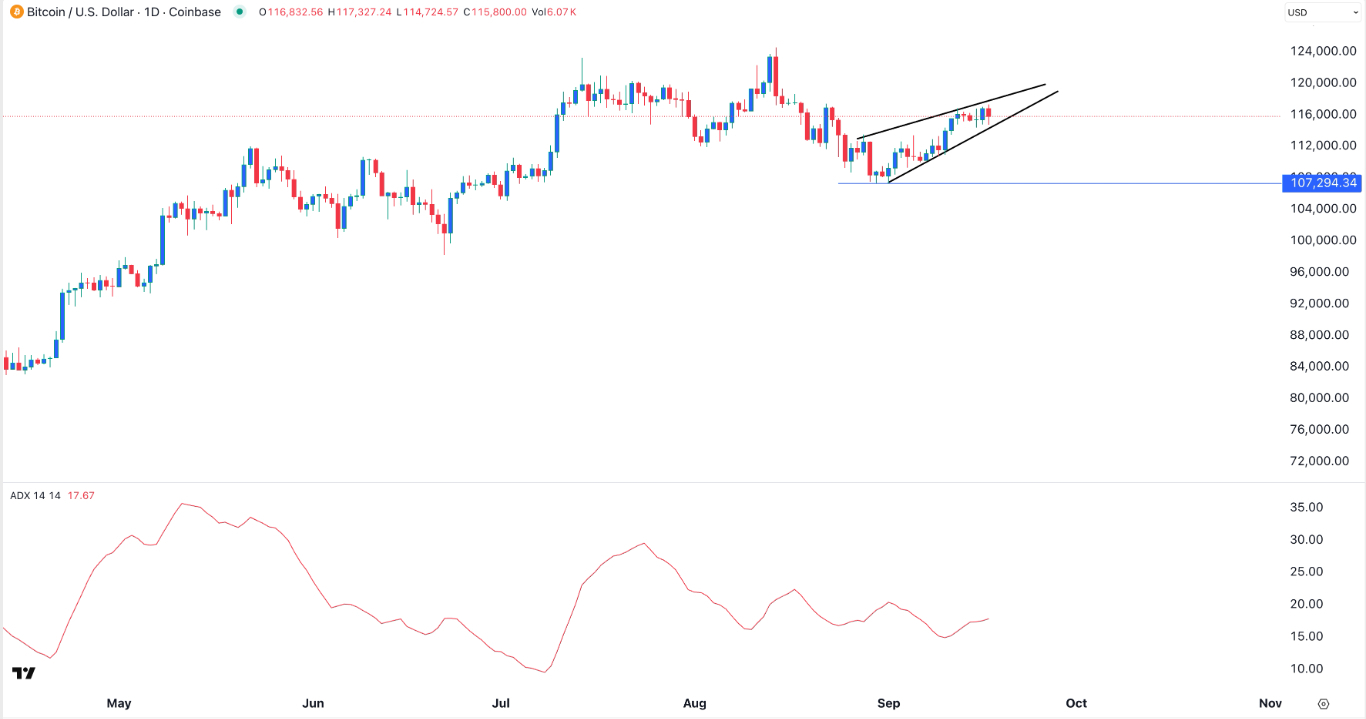
The daily timeframe chart shows that the BTC/USD pair has bounced back from a low of 102,295 earlier this month to 116,000 today.
This rebound was mostly because of the expectations that the Federal Reserve would cut interest rates, which has already happened.
There is a risk that the Bitcoin price will pullback briefly as investors sell the news and as the coin forms the highly bearish rising wedge chart pattern on the daily chart. The two lines of this pattern are nearing their confluence level.
Also, the upward momentum is waning as the Average Directional Index (ADX) has moved sideways in the past few days. Therefore, it will likely drop to the important support level at 100,000. On the other hand a move above the upper side of the wedge will invalidate the bearish outlook.
More By This Author:
EUR/USD Forex Signal: Targets 1.2000 Ahead Of The Fed Decision
BTC/USD Forex Signal: Bullish Trend Is Losing Momentum
GBP/USD Forex Signal: Bullish Forecast Ahead Of Fed And BoE Decisions
Risk Disclaimer: DailyForex will not be held liable for any loss or damage resulting from reliance on the information contained within this website including market news, analysis, trading signals ...
more


