BTC/USD Forex Signal: Rising Broadening Wedge Pattern Forms
Bearish View
- Sell the BTC/USD pair and set a take-profit at 85,175.
- Add a stop-loss 100,000.
- Timeline: 1-2 days.
Bullish View
- Buy the BTC/USD pair and set a take-profit at 100,000.
- Add a stop-loss at 85,175.
(Click on image to enlarge)
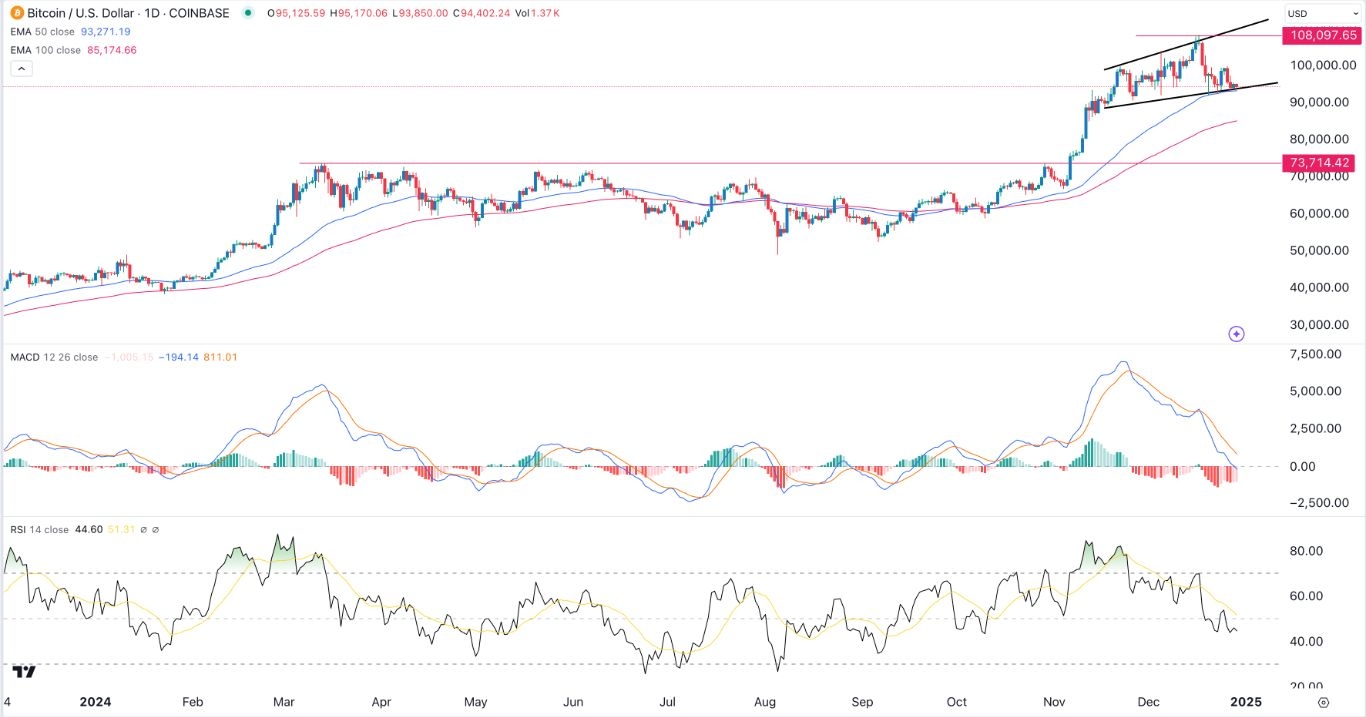
The BTC/USD pair has formed a high-risk pattern, pointing to more downside in the next few weeks. Bitcoin was trading at $94,428 on Monday morning, down from the year-to-date high of $108,000.
Bitcoin’s weakness has coincided with the recent decision by the Federal Reserve to embrace a hawkish tone, which has in turn, led to higher bond yields. The ten-year yield rose to 4.630%, while the 30-year and 5-year rose to 4.82% and 4.46%.
Higher bond yields often have a negative impact on risky assets, which explains why the stock market has also retreated in the past few weeks. The Dow Jones index fell by 310 points on Friday, while the Nasdaq 100 and S&P 500 fell by over 1.1% on the same day.
Bitcoin’s price action has also coincided with the ongoing low-volume environment because of the Christmas holiday celebrations. This low volume trajectory will continue this week as most markets will be closed for the new year.
There are no major economic numbers scheduled this week, which will reduce the hype. However, the coin may benefit from the concept of January Effect, which may see Bitcoin and other risky assets continue rising.
BTC/USD Technical Analysis
Bitcoin price peaked at $108,097 earlier this month as the uptrend momentum gained steam. It then started dropping, a trend that accelerated after the hawkish Federal Reserve interest rate decision.
The two lines of the MACD indicator have continued falling and are approaching the zero line, a sign of a bearish divergence. Similarly, the Relative Strength Index (RSI) has continued moving in the same direction and has dropped below 50.
Most notably, the pair has formed a rising broadening wedge pattern, a popular reversal sign in the market. It sits on the lower side of this pattern and at the 50-day moving average.
Therefore, a break below the two support levels will point to more downside, with the next point to watch being at the 100-day moving average point at 85,175. On the flip side, a move above the key resistance at 100,000 will point to more gains, potentially to the all-time high of 108,097.
More By This Author:
Is Palo Alto Networks A Good Cybersecurity Stock For 2025?Robinhood Stock Price Has A 42% Upside But Faces Key Risks
Match Group Stock Forms Triangle: Will It Crash In 2025?
Disclosure: DailyForex will not be held liable for any loss or damage resulting from reliance on the information contained within this website including market news, analysis, trading signals ...
more


