BTC/USD Forex Signal: Ripe For A Bearish Breakout To 18,500
Bearish view
- Set a sell-stop at 19,520 and a take-profit at 18,500.
- Add a stop-loss at 21,000.
- Timeline: 1-2 days.
Bullish view
- Set a buy-stop at 20,400 and a take-profit at 22,000.
- Add a stop-loss at 18,000.
The BTC/USD pair remained below the important support level at 20,000 as concerns about demand remained. Bitcoin was trading at $19,735, which was slightly above August’s low of $19,553. It has crashed by more than 50% in 2022.
Bitcoin continues its struggle
The BTC/USD price has been in a strong bearish trend in the past few weeks as investors continued worrying about the Federal Reserve. The Federal Reserve has maintained an extremely hawkish tone this year in a bid to lower the soaring inflation. It has hiked interest rates by 225 basis points this year and introduced a quantitative tightening (QT) policy.
The Fed is expected to maintain a hawkish tone in the next few months since inflation is expected to remain at elevated levels in the coming months. For example, during the weekend, Russia said that it will suspend gas flows using the Nord Stream 1 pipeline. As a result, gas prices are expected to keep rising in the coming months.
BTC/USD price continued falling even after the latest American jobs numbers that came out on Friday. The numbers showed that the country’s unemployment rate rose to 3.7% as the rate of hiring slowed in August. Still, the labor market is still tight, considering that the country has over 11 million job vacancies.
The strong US dollar has also contributed to the recent BTC sell-off. The closely watched dollar index soared to a 20-year high of $109.35. This trend will continue as geopolitical challenges continue. The crisis in Ukraine and the tensions between the US and China have pushed more people to the US dollar.
Meanwhile, on-chain data shows that Bitcoin’s demand is still sluggish. The total number of BTC transactions has dropped and the number of people buying the coin has slipped.
BTC/USD forecast
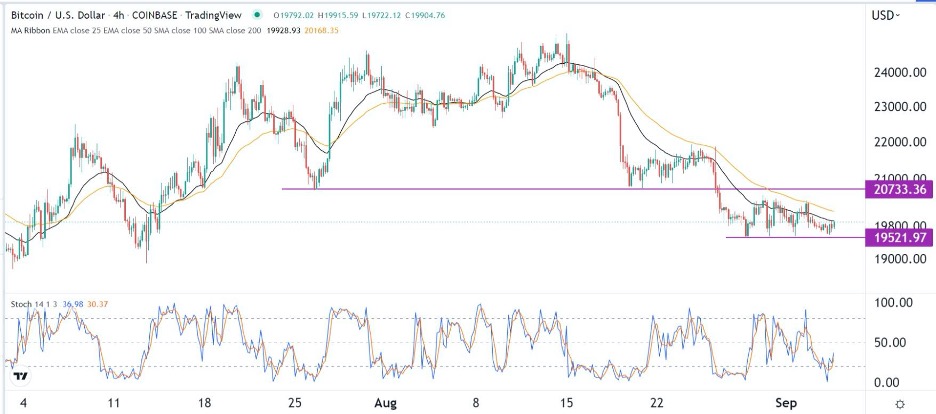
The four-hour chart shows that the BTC/USD pair has been in a strong bearish trend in the past few months. This month, it managed to move below the 25-day and 50-day moving averages while the Stochastic Oscillator has pointed upwards. The pair is slightly above the important support at 19,520, which was the lowest level this month.
Therefore, the pair will likely have a bearish breakout as sellers target the next key support level at 18,500. A move above the resistance level at 20,500 will invalidate the bearish view.
(Click on image to enlarge)

More By This Author:
Dow Jones Technical Analysis: Closed At The Lowest LevelsBTC/USD Signal: Break And Retest Points To More Downside
USD/JPY Technical Analysis: Upside Path May Remain
Disclosure: DailyForex will not be held liable for any loss or damage resulting from reliance on the information contained within this website including market news, analysis, trading signals ...
more


