BTC/USD Forex Signal: Pullback Expected As Rising Wedge Forms
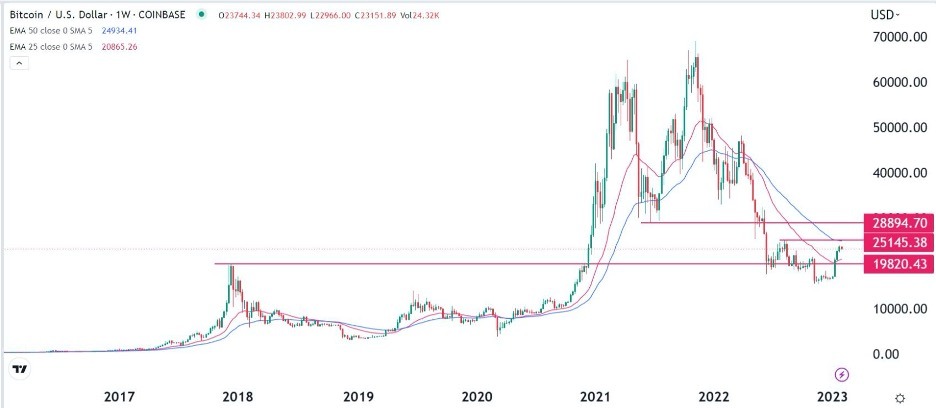
The BTC/USD price is between the 50-week and 25-week moving averages and a few points below the resistance at 25,145 (August 2022 high).
Bearish view
- Sell the BTC/USD pair and set a take-profit at 22,000.
- Add a stop-loss at 24,000.
- Timeline: 1-2 days.
Bullish view
- Set a buy-stop at 23,500 and a take-profit at 25,000.
- Add a stop-loss at 22,000.
The BTC/USD pair pulled back slightly as bond yields and the US dollar index (DXY) rose while American stocks pulled back. Bitcoin price retreated to a low of $22,843, which was lower than the weekend high of nearly $24,000.
Bitcoin weekly chart analysis
Like other financial assets, Bitcoin will react to the upcoming interest rate decision by the Federal Reserve. Economists expect that the Fed will continue its hiking cycle since inflation remains at an elevated level. A key concern is that gasoline prices have remained stubbornly above $3 in the past few days.
On the weekly chart, we see that the BTC/USD price has made a steady bullish comeback in the past few days. As it rose, the pair moved slightly above the important resistance point at $19,820 (December 2017 high. Looking back, the chart shows that the recent crash happened after the coin formed a double-top pattern.
The BTC/USD price is between the 50-week and 25-week moving averages and a few points below the resistance at 25,145 (August 2022 high). Therefore, while the overall bearish trend is persisting, the pair will likely continue rising and retest the resistance at 25,145. A further upside above this price will see it rise to 28,895.
(Click on image to enlarge)

BTC/USD daily chart analysis
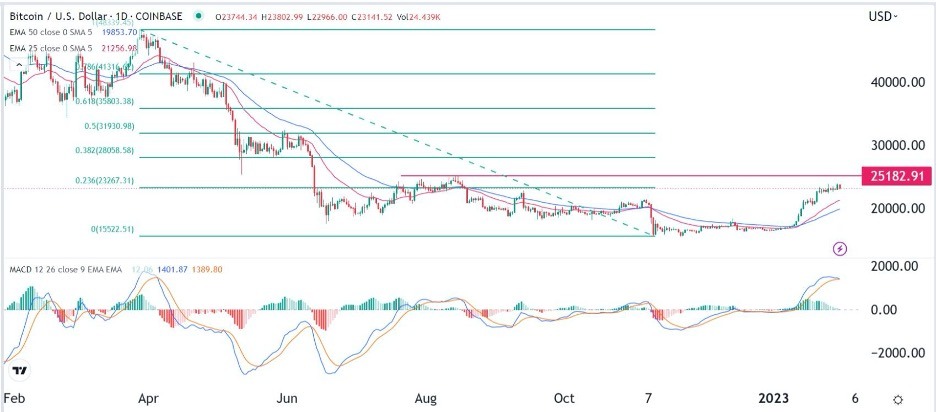
The daily chart is a bit different from the weekly chart. For one, the pair has moved to the 23.6% Fibonacci Retracement level and is approaching the key resistance at 25,182 (August 16 high). The 25-day and 50-day moving averages have made a bullish crossover pattern while the MACD remains above the neutral point. The two lines of the MACD appear to be forming a bearish crossover while the histogram is at the neutral level.
Therefore, the pair will likely remain in the current range and possibly retest the resistance at 25,182 before the FOMC decision.
(Click on image to enlarge)

BTC/USD 4H analysis
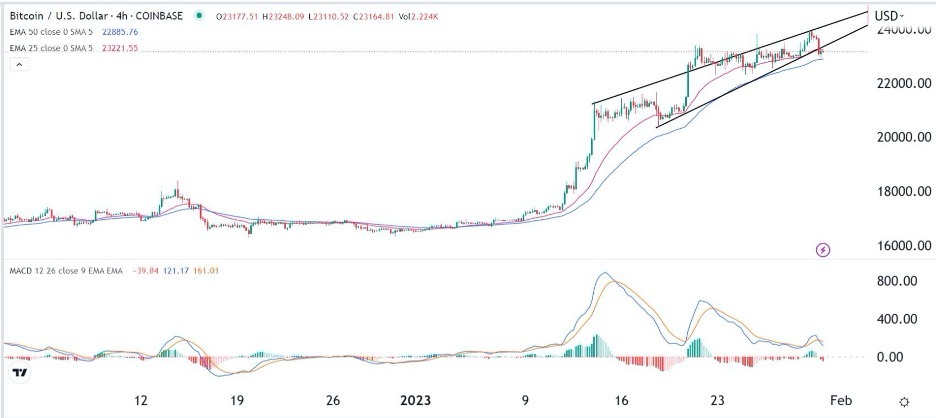
The BTC/USD chart has been in a slow bullish trend in the past few days. Like in the daily chart, the pair remains solidly above the 25-day and 50-day moving averages. The main difference is that the MACD is forming a bearish divergence pattern, which is usually a bearish sign.
Also, it has formed an ascending wedge, which is also a dangerous pattern. Therefore, for the immediate near term, the pair will likely have a bearish breakout since the wedge pattern is nearing its confluence level. As such, it could pull back to the psychological level of 22,000.
(Click on image to enlarge)

More By This Author:
Dow Jones Technical Analysis: The Index Is Preparing To Attack An Important ResistanceForex Today: Bitcoin Reaches 6-Month High
Trading Support And Resistance - Sunday, Jan. 29
Disclosure: DailyForex will not be held liable for any loss or damage resulting from reliance on the information contained within this website including market news, analysis, trading signals ...
more


