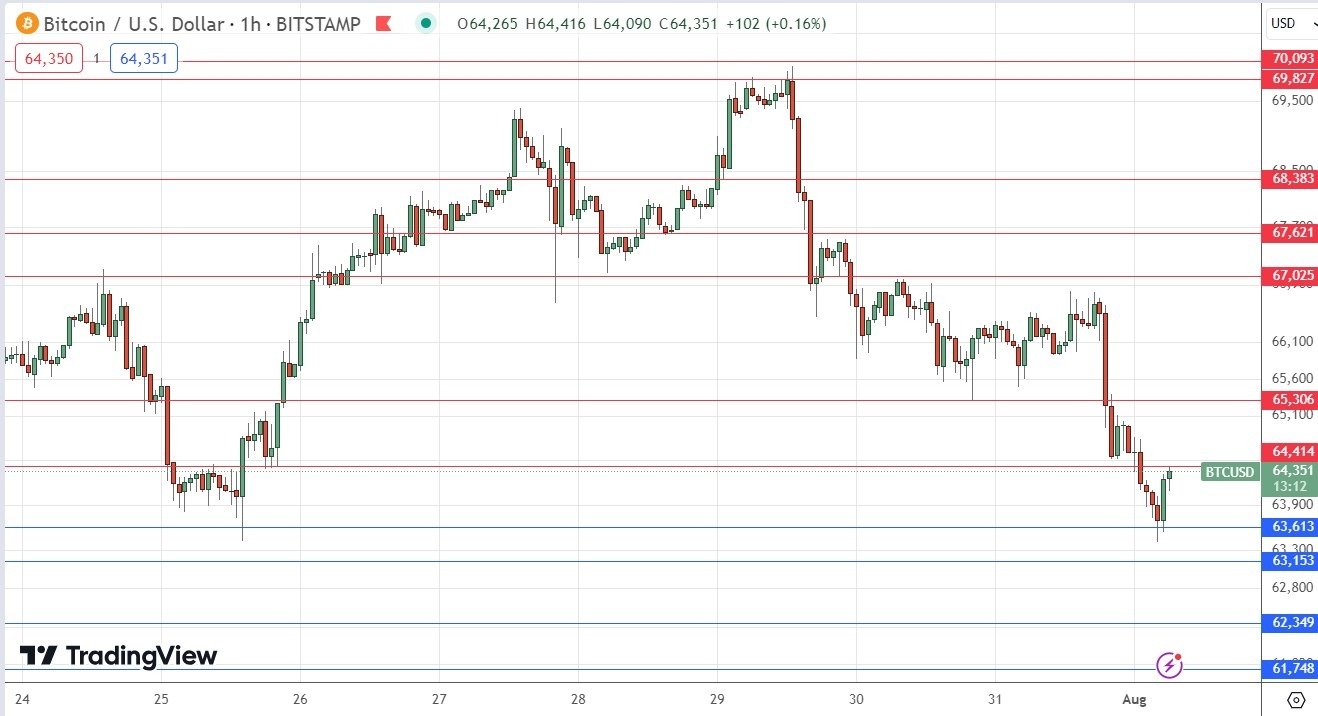
BTC/USD Forex Signal: Possibly Bullish Double Bottom At $63,613
My previous BTC/USD signal on 29th July was not triggered as there was no bullish price action when any of the key support levels were first reached.
Today’s BTC/USD Signals
- Risk 0.75% per trade.
- Trades must be entered before 5pm Tokyo time Friday.
(Click on image to enlarge)
Long Trade Ideas
- Go long after a bullish price action reversal on the H1 timeframe following the next touch of $63,613, $63,153, or $62,349.
- Put the stop loss $100 below the local swing low.
- Move the stop loss to break even once the trade is $100 in profit by price.
- Take off 50% of the position as profit when the trade is $100 in profit by price and leave the remainder of the position to run.
Short Trade Ideas
- Go short after a bearish price action reversal on the H1 timeframe following the next touch of $64,414, $65,306, or $67,025.
- Put the stop loss $100 above the local swing high.
- Move the stop loss to break even once the trade is $100 in profit by price.
- Take off 50% of the position as profit when the trade is $100 in profit by price and leave the remainder of the position to run.
The best method to identify a classic “price action reversal” is for an hourly candle to close, such as a pin bar, a doji, an outside or even just an engulfing candle with a higher close. You can exploit these levels or zones by watching the price action that occurs at the given levels.
BTC/USD Analysis
I wrote in my previous BTC analysis on 29th July that the area at $70,093 was likely to be pivotal, and we saw bullish momentum that was likely to fade as the price approached $74,000.
This was not such a very relevant call, as the price never reached that level, but turned bearish and began the journey down to where the price is sitting now.
We have seen some bearish momentum over the past few days, which is notable as other risky assets such as stock markets have mostly seen gains. This suggests a relative weakness in Bitcoin.
Technically, the support level at $63,613 seems to have provided a strong bullish inflection point with an impulsive move up from that support, suggesting that we are now seeing a bullish double bottom at $63,613. If true, this could be a good long trade entry for longer-term traders. Shorter-term traders should wait for another bullish bounce off that level.
The long-term trend is still bullish, albeit very weakly, so the odds over the longer-term are likely more in favour of long trades.
There is nothing of high importance due today regarding Bitcoin or the US Dollar.
More By This Author:
Forex Today: Yen Soars On More Hawkish Bank Of JapanEUR/USD Forex Signal: Downwards Trend Continues
Weekly Forex Forecast - Sunday, July 28
Risk Disclaimer: DailyForex will not be held liable for any loss or damage resulting from reliance on the information contained within this website including market news, analysis, trading signals ...
more


