BTC/USD Forex Signal: Path Of Least Resistance Is Downwards
Bearish view
- Sell the BTC/USD pair and set a take-profit at 50,000.
- Add a stop-loss at 57,000.
- Timeline: 1-2 days.
Bullish view
- Buy the BTC/USD pair and set a take-profit at 67,000.
- Add a stop-loss at 50,450.
(Click on image to enlarge)
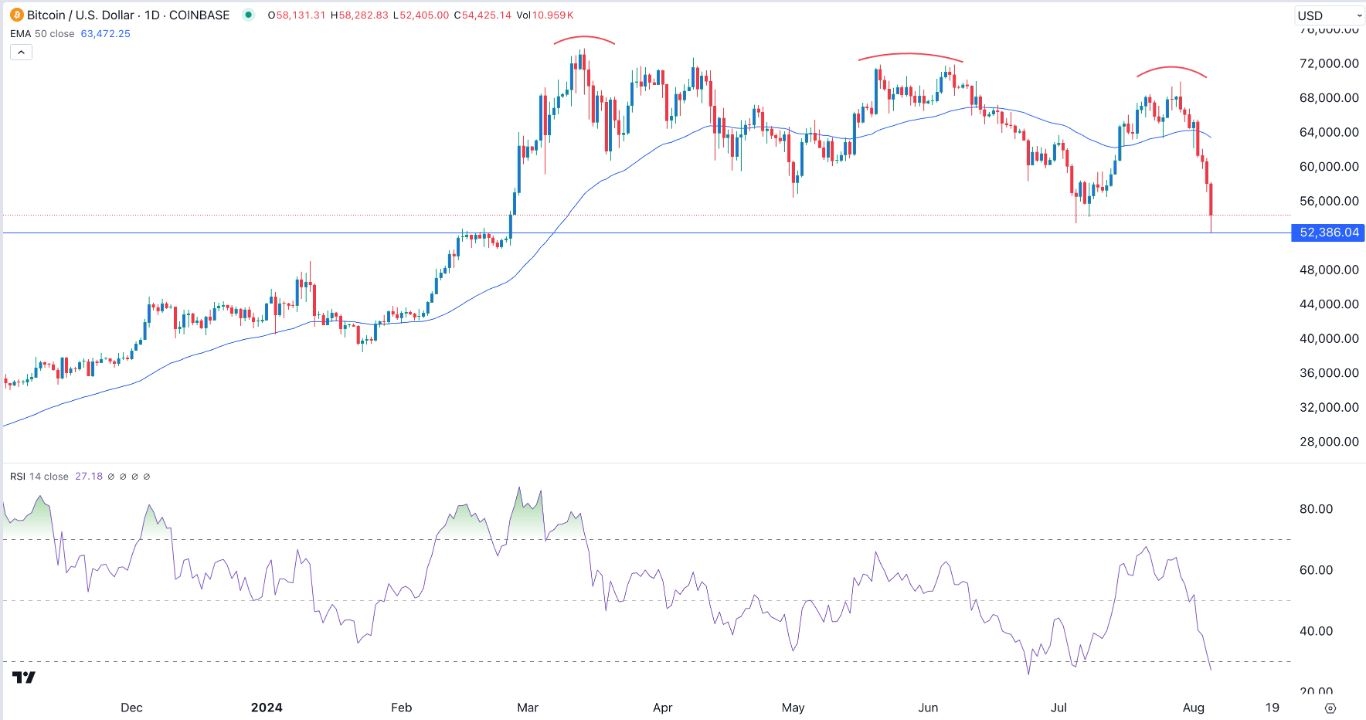
Bitcoin price continued its freefall during the weekend, joining other risky assets in a strong sell-off amid rising recession fears. The BTC/USD pair moved below the key support at 60,000 for the first time since July 14.
Bitcoin’s crash happened as investors moved to less risky assets after the weak US jobs data. In a report, the Bureau of Labor Statistics (BLS) showed that the economy created over 114k jobs in July, the lowest reading in months.
The unemployment rate rose while wage growth continued deteriorating during the month. More data pointed to a potential downturn of the US economy as the initial jobless rate rose to its highest point since August last year.
In theory, these numbers should be positive for Bitcoin and other risky assets since they mean that the Federal Reserve could start cutting interest rates in its September meeting. The bank has already hinted that it will start cutting rates because of the deteriorating conditions.
The other main reason why Bitcoin and stocks are falling is the strong Japanese yen comeback. The USD/JPY pair has slumped to 146 on Friday, down from the year-to-date high of 161.76.
This rebound happened after the Bank of Japan (BoJ) surprised the market by hiking interest rates by 0.25% in its most recent decision last week. It has now hiked rates by 40 basis points this year.
The rate hikes have led to many investors to unwind their carry trades, where they borrowed the yen at low interest rates to invest in high-rate environments. This carry trade has worked well since the bank’s interest rates have remained low for a long time.
BTC/USD technical analysis
The daily chart shows that the BTC/USD pair has been in a strong bearish trend in the past few days. It has formed a series of lower highs at 73,800, 72,000, and 70,000. The pair has also moved below the 50-day moving average while the two lines of the MACD have formed a bearish crossover.
The Relative Strength Index (RSI) has moved below 30 and is pointing downwards. Therefore, the pair will likely continue falling as sellers target the key support at 50,000, its psychological level.
More By This Author:
EUR/USD Forex Signal: Symmetrical Triangle Forms Ahead Of FOMCBTC/USD Forex Signal: Inverse Head And Shoulders Forms
BTC/USD Forex Signal: Bitcoin Rally Has More Room To Run
Disclosure: DailyForex will not be held liable for any loss or damage resulting from reliance on the information contained within this website including market news, analysis, trading signals ...
more


