BTC/USD Forex Signal: On The Cusp Of A Bullish Breakout
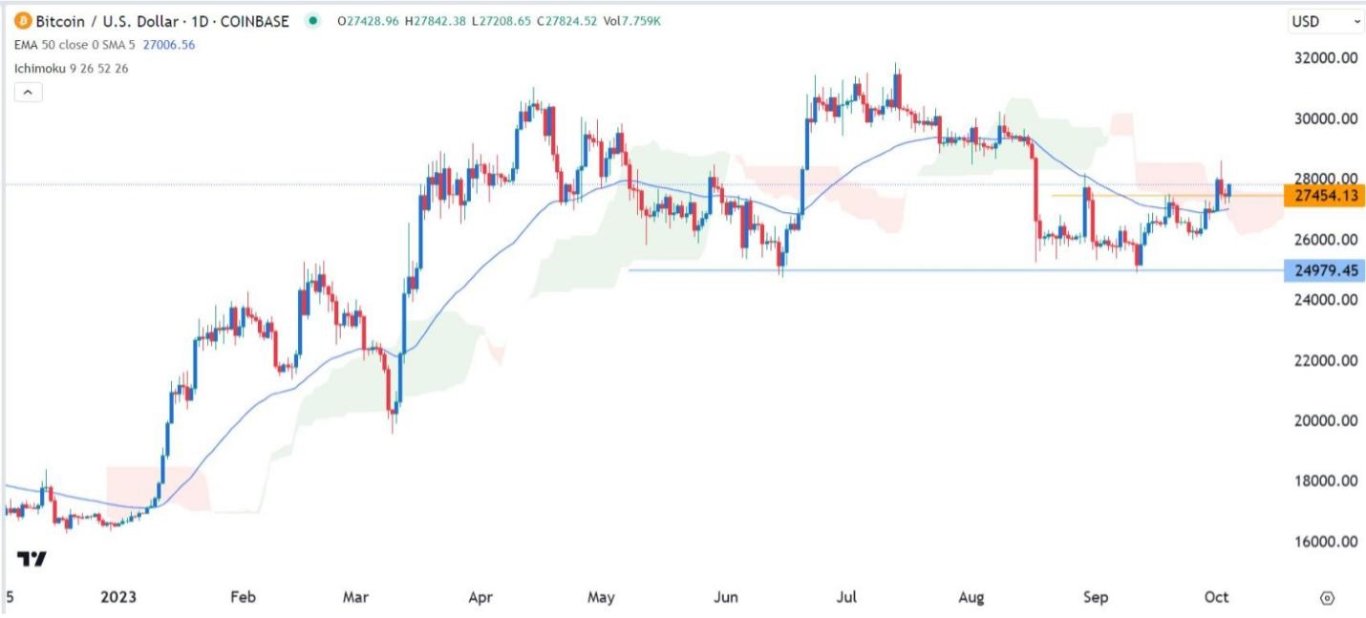
The daily chart shows that the BTC/USD pair has held quite well in the past few days.
Bullish view
- Buy the BTC/USD pair and set a take-profit at 28,600.
- Add a stop-loss at 26,400.
- Timeline: 1 day.
Bearish view
- Set a sell-stop at 26,700 and a take-profit at 25,500.
- Add a stop-loss at 28,000.
The BTC/USD pair has stabilized in the past few days after losing the momentum it had on Monday. Bitcoin remained above $27,500, higher than last month’s low of $24,980. This price is a few points below this week’s high of $28,568.
Low volatility continues
Bitcoin price remained in a tight range as American stocks bounced back and bond yields retreated. The Nasdaq 100 index jumped by more than 100 points while the S&P 500 index jumped by more than 15 points.
At the same time, the 10-year bond yield retreated to 4.736% while the 30-year and 5-year yields dropped to 4.87% and 4.79%, respectively. This price action happened after ADP published a weak private payrolls report.
The data showed that the private sector added 89k jobs in September, the lowest level in a long time. This data was lower than the median estimate of 186k jobs. Therefore, the theory is that the softening labor market will push the Fed to continue pausing interest rates.
Besides, there are signs that the economy is weakening at a faster pace. For example, the ongoing UAW strike is expected to have an impact on the economy because the auto industry is responsible for ~3% of the economy. There are also risks of a government shutdown in the next 40 days.
Bitcoin also stabilized after another legal victory in the crypto industry. In a statement, a US judge denied SEC’s motion to appeal the case against Ripple labs. Judge Analisa Torres said that the SEC had failed to meet the burden under the law.
The SEC sued Ripple Labs and its executives claiming that they sold XRP as a security in 2013. In a landmark ruling in July, the judge ruled that XRP was not a security. The SEC recently lost another case against Grayscale.
BTC/USD technical analysis
The daily chart shows that the BTC/USD pair has held quite well in the past few days. It has remained above the key support of $24,979, the lowest point on September 11th and June 15th. The pair remains above the 50-day moving average and the Ichimoku cloud indicator,.
Bitcoin also sits above the important support level at $27,455, the highest point on September 19th. Therefore, the pair will likely continue rising as buyers target this week’s high of 28,600.
(Click on image to enlarge)

More By This Author:
EUR/USD Technical Analysis: Compensating For Sharp LossesGold Technical Analysis: Looking For An Opportunity To Bounce Higher
EUR/USD Forex Signal: Death Cross Points To A Drop To Parity
Disclosure: DailyForex will not be held liable for any loss or damage resulting from reliance on the information contained within this website including market news, analysis, trading signals ...
more


