BTC/USD Forex Signal: Neutral Sentiment With A Bullish Bias
Bullish view
- Buy the BTC/USD pair and set a take-profit at 20,500.
- Add a stop-loss at 18,500.
- Timeline: 1-2 days.
Bearish view
- Set a sell-stop at 19,250 and a take-profit at 18,500.
- Add a stop-loss at 20,500.
The BTC/USD price continued wavering as investors waited for another catalyst and as the US dollar index pulled back. It rose to $19.500, which was much higher than last week’s low of 18,150. Other coins remained in consolidation mode.
Volatility slips
Bitcoin has been in a strong consolidation phase in the past few months as activity in the network remains relatively vibrant. On-chain data shows that the hash rate has surged to the highest level on record. Hash rate refers to the computation power in a proof-of-work platform like Bitcoin.
A higher rate is usually a sign of the health, security, and mining difficulty of the chain. Historically, a high hash rate is usually a sign that activity in the network is substantially healthy. Other on-chain data like the number of on-chain transactions has been rising in the past few days.
Bitcoin has also ignored popular economic data that used to move it in the past. For example, last week, it moved mildly after the strong American inflation data. The numbers revealed that the headline and core inflation continued rising on a month-on-month basis.
Similarly, Bitcoin went sideways when the US published strong job numbers earlier this month. These numbers revealed that the American unemployment rate declined to 3.5% in September. As such, a combination of a low unemployment rate and high inflation means that the Fed will likely continue hiking interest rates.
The BTC/USD price tilted upwards slightly as the US dollar pulled back slightly. The dollar index, which measures the performance of the US dollar against a basket of currencies, declined to about $113, which was lower than the year-to-date high of about $115. In a note, an analyst at Kaiko told CNBC:
“Hovering around yearly lows in trade volumes, bitcoin and ether are crying out for the next crypto-specific catalyst that will kickstart another bull run and a decoupling from equities.”
BTC/USD forecast
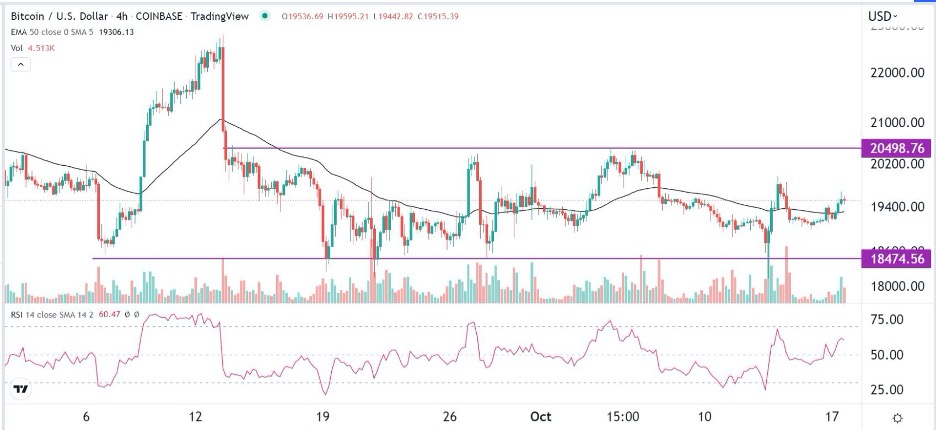
The four-hour chart shows that the BTC/USD price has remained in a tight range in the past few days. It managed to move slightly above the 50-day moving average while the Relative Strength Index (RSI) moved slightly above the important neutral point at 50. Volume remains quite a under pressure.
Therefore, more upside will be confirmed if Bitcoin manages to move above $20,000 in a high-volume environment. If this happens, it will then rise to $21,000.
(Click on image to enlarge)

More By This Author:
GBP/USD Outlook: GBP Snaps Five-Day Losing Streak Against The GreenbackNatural Gas Technical Analysis: Price Finds Some Support
EUR/USD Forex Signal: Euro Is Still Ripe For A Bearish Breakout
Disclosure: DailyForex will not be held liable for any loss or damage resulting from reliance on the information contained within this website including market news, analysis, trading signals ...
more


