BTC/USD Forex Signal: Neutral Outlook With A Bearish Bias
Bearish view
- Sell the BTC/USD pair and set a take-profit at 91,290.
- Add a stop-loss at 108,350.
- Timeline: 1-2 days.
Bullish view
- Set a buy-stop at 98,000 and a take-profit at 100,000.
- Add a stop-loss at 108,000.
(Click on image to enlarge)
Bitcoin price held steady above the $97,000 level after the US published the latest inflation data that signalled a more hawkish Federal Reserve ahead. The BTC/USD pair rose to 97,100, up from this week’s low of 94,000.
Hawkish Federal Reserve
The BTC/USD pair has remained in a consolidation phase as market participants waited for the next catalyst.
Wednesday’s inflation numbers did not move the coin even as American stocks dropped. The headline consumer inflation rose above 3% for the first time in months. Similarly, the core consumer inflation rose to 3.3%, remaining significantly above the Federal Reserve’s target of 2.0%.
These numbers mean that the Federal Reserve will either hold interest rates steady at 4.50% in the next few meetings. Some analysts, including Mohamed El-Erian, believes that the Federal Reserve should consider hiking interest rates since inflation remains high.
Bitcoin and other cryptocurrencies do well when the Federal Reserve is hawkish since it leads to higher bond yields. Investors often rotate from risky assets like cryptocurrencies when interest rates are rising.
Bitcoin has also wavered as ETF inflows remain under pressure this week. These funds have not had substantial inflows this week as investors remain on the sidelines as they wait for the next bullish wave.
BTC/USD Technical Analysis
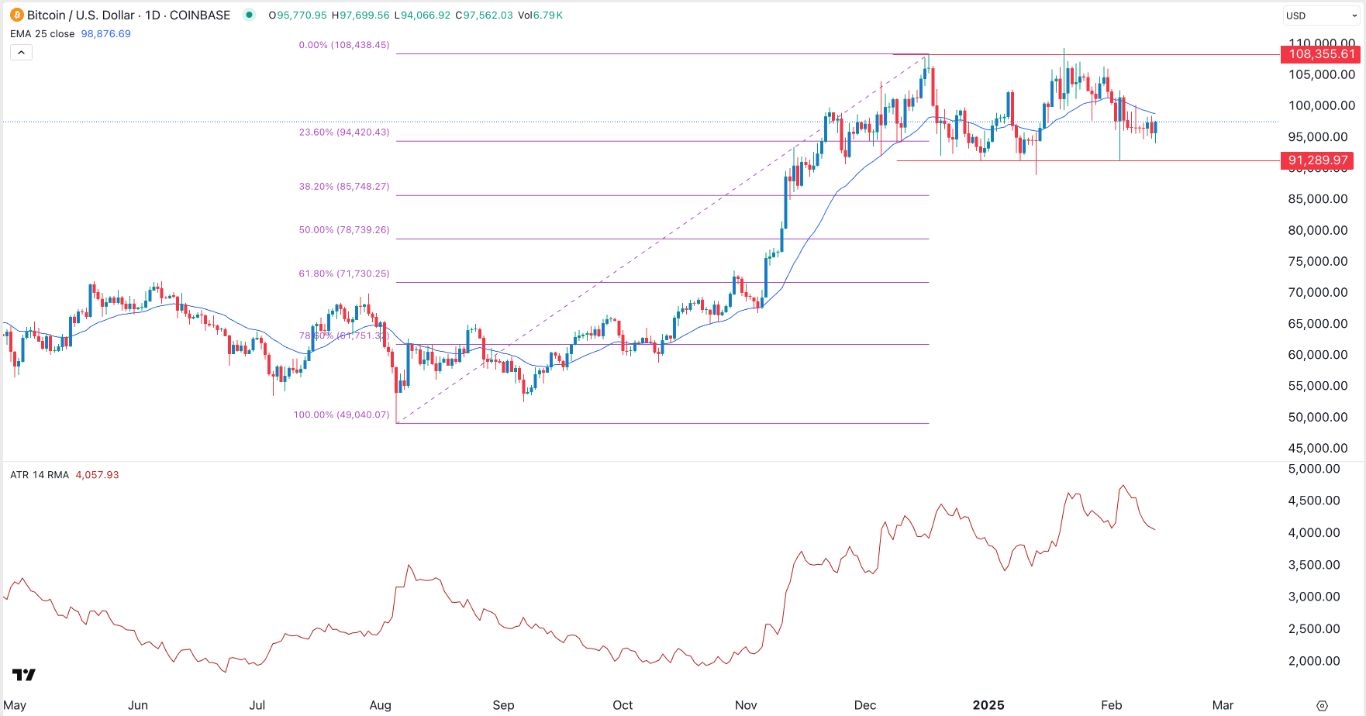
Bitcoin has remained in a tight range in the past few months. It has moved between the key resistance and support levels at $108,355 and $91,30, where it has been since November last year.
The BTC/USD pair has retreated below the 50-day moving average and it remains above the 23.6% Fibonacci Retracement level. Further, the Average True Range (ATR), a popular measure of volatility, has pointed downwards, a sign that the market is not as volatile as it was a while ago.
Bitcoin has formed a double-top chart pattern at 108,355, a popular bearish sign. Therefore, there is a likelihood that the pair will remain on edge this week and then have a breakdown in the coming days. More downside will be confirmed if Bitcoin drops below the support at 91,290, the lower side of the double-top pattern. A break below that level will see it drop to the 50% retracement point at $78,740.
More By This Author:
AUD/USD Forex Signal: Recovery Intact, But Faces Strong Resistance
BTC/USD Forex Signal: Double-Top Points To A Drop To 90,000
EUR/USD Forex Signal: Pressured By The US Dollar Index Rebound
Disclosure: DailyForex will not be held liable for any loss or damage resulting from reliance on the information contained within this website including market news, analysis, trading signals ...
more


