BTC/USD Forex Signal: Neutral Outlook With A Bearish Bias
Bitcoin tumbled to a low of $28,462, the lowest level since June 20th.
Bearish view
- Sell the BTC/USD pair and set a take-profit at 28,450.
- Add a stop-loss at 30,000.
- Timeline: 1-2 days.
Bullish view
- Set a buy-stop at 29,200 and a take-profit at 30,000.
- Add a stop-loss at 28,000.
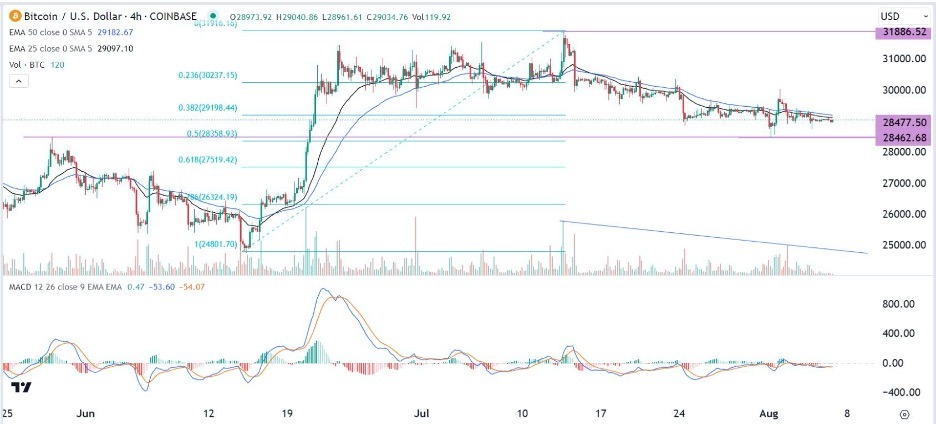
The BTC/USD pair remained in a consolidation phase on Monday as demand and volatility slipped. Bitcoin was trading at $29,000, where it has been at in the past few weeks. It remains much lower than the year-to-date high of 31,886.
Bitcoin consolidation continues
Bitcoin has reacted mildly to several important events that have happened in the past few months. Last week, the coin ignored the unprecedented credit rating downgrade of the United States by Fitch, one of the big three rating agencies.
In its statement, the company cited the dysfunction in Washington and the soaring budget deficits. The rate downgrade from AAA to AA+ led to a major jump in the US dollar index and a drop of American equities as investors embraced a risk-off sentiment. The Dow Jones and Nasdaq 100 indices dropped sharply last week.
In theory, the rate downgrade ought to be a bullish thing for Bitcoin since it is widely seen as a safe haven and a good alternative to the US dollar.
Further, Bitcoin price reacted mildly to last Friday’s non-farm payrolls (NFP) data. Numbers by the Bureau of Labor Statistics (BLS) showed that the economy created over 187k jobs in July. The unemployment rate dropped from 3.6% to 3.5%, the lowest level in decades.
Also, Bitcoin has remained unchanged after the partial victory by Ripple in the long-running battle with the Securities and Exchange Commission (SEC).
Therefore, there is a likelihood that the BTC/USD price will react mildly to this week’s consumer price index (CPI) data. Economists believe that inflation remained above 3% in July while core inflation was unchanged at 4.8%.
BTC/USD technical analysis
Bitcoin tumbled to a low of $28,462, the lowest level since June 20th. The BTC/USD pair has formed a head and shoulders pattern on the four-hour chart. This pattern is usually a bearish signal.
Bitcoin has remained below the 38.2% Fibonacci Retracement level. It has also moved below the 25-period and 50-period exponential moving averages (EMA). The MACD has moved slightly below the neutral point while volume has drifted downward.
Therefore, the pair will likely continue falling as sellers target the key support at 28,468. The stop-loss of this trade will be at 30,000.
(Click on image to enlarge)

More By This Author:
USD/JPY Technical Analysis: The General Trend is Still BullishGold Technical Analysis: Going Long Is Still The Best Trading Strategy
GBP/USD: Weekly Forecast For Aug. 7-12
Disclosure: DailyForex will not be held liable for any loss or damage resulting from reliance on the information contained within this website including market news, analysis, trading signals ...
more


