BTC/USD Forex Signal: Multi-Timeframe Analysis Points To More Upside
Bullish view
- Buy the BTC/USD pair and set a take-profit at 73,500.
- Add a stop-loss at 64,000.
- Timeline: 1-2 days.
Bearish view
- Set a sell-stop at 68,000 and a take-profit at 65,000.
- Add a stop-loss at 71,000.
(Click on image to enlarge)
Bitcoin price continued its strong bull run this week as demand for the coin rose. The BTC/USD pair jumped to a high of 70,000, its highest swing since April 12th. It has soared by over $9,000 from its lowest point this month.
Bitcoin’s surge gained steam as traders reacted to the weak inflation numbers, which led to hopes that the Federal Reserve will start to cut interest rates soon. It also coincided with the performance of global stocks, which have surged hard in the past few weeks and are trading at their highest point on records.
Bitcoin has also soared as investors react to the ongoing ETF inflows. The most recent data shows that the iShares Bitcoin ETF (IBIT) assets have jumped to a record high of over $18.5 billion. Other funds like those by Fidelity, Ark Invest, Franklin Templeton, and Invesco have seen their assets jump.
BTC/USD technical analysis
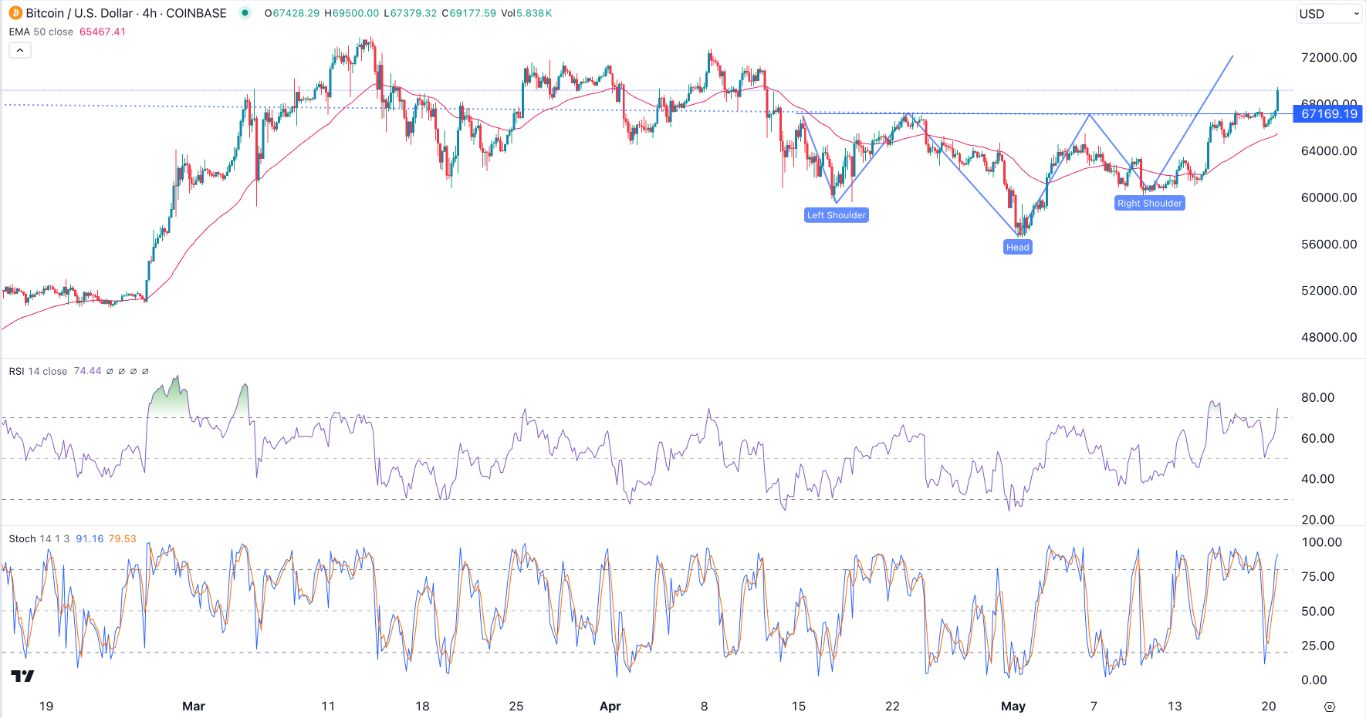
The 4H chart shows that the price of Bitcoin has jumped sharply in the past few weeks. It has soared from this month’s low of $60,000 to almost $70,000. The BTC/USD pair has jumped above the crucial resistance at 67,170, the neckline of the inverse head and shoulders pattern.
Bitcoin has also rallied above the Ichimoku cloud indicator and the 50-period Exponential Moving Averages. At the same time, the Relative Strength Index (RSI) and the stochastic oscillator have all pointed upwards.
Therefore, the outlook for the BTC/USD pair is bullish, with the next level to watch being the year-to-date high of over 73,000. The stop-loss of this trade is at 67,170, its highest swing on April 23rd.
BTC/USD daily chart analysis
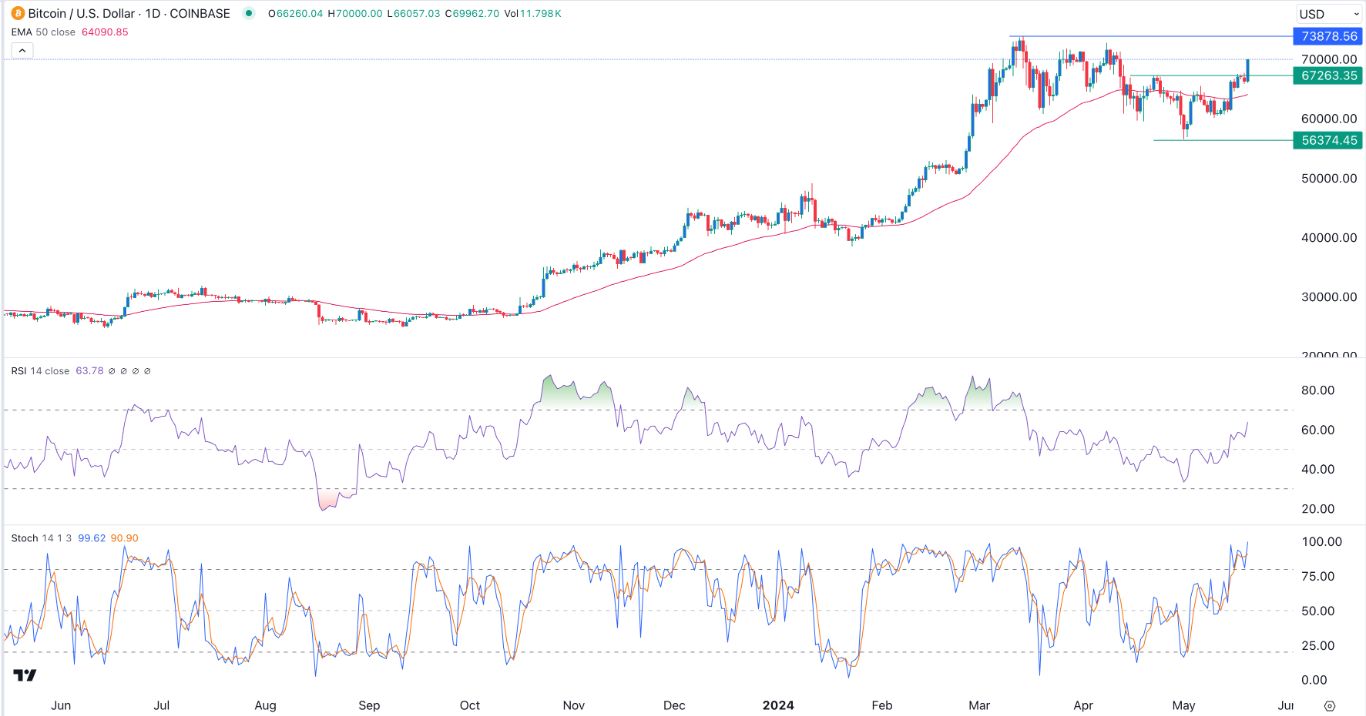
Turning to the daily chart, we see that the price of Bitcoin bottomed at 56,375, its lowest point on May 1st. The pair has crossed the important resistance level at 67,263, its highest swing on April 23rd.
It has also jumped above the 50-day moving average. At the same time, the RSI has just crossed the neutral point at 50 and is nearing the overbought level. The Stochastic Oscillator has moved above the overbought level.
Therefore, the pair’s outlook is bullish, as buyers attempt to retest its highest level this year. If this happens, the pair will likely rise as buyers target the key point at 73,870.
(Click on image to enlarge)
More By This Author:
Platinum Price Analysis: Bearish Engulfing Pattern FormsAUD/USD Forex Signal: Golden Cross Pattern Nears
SPY And QQQ ETFs: Don’t Sell In May And Go Away
Disclosure: DailyForex will not be held liable for any loss or damage resulting from reliance on the information contained within this website including market news, analysis, trading signals ...
more


