BTC/USD Forex Signal: More Downside Expected As Sentiment Wanes
Bearish view
- Sell the BTC/USD pair and set a take-profit at 56,000.
- Add a stop-loss at 62,000.
- Timeline: 1-2 days.
Bullish view
- Set a buy-stop at 60,500 and a take-profit at 62,000.
- Add a stop-loss at 56,000.
(Click on image to enlarge)
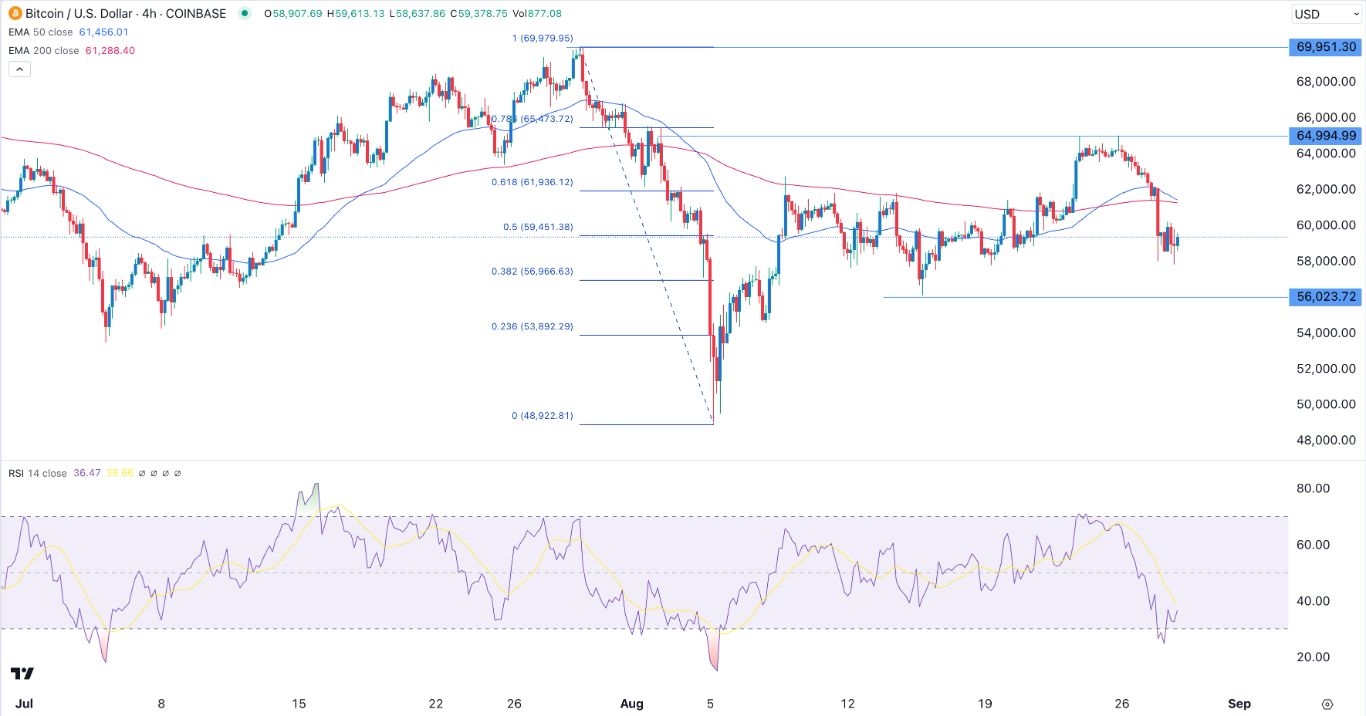
Bitcoin remained on edge overnight as demand for the coin waned. After peaking at 64,955 last week, the BTC/USD pair has dropped below 60,000 and returned to a range where it spent the last three weeks at. It was trading at 59,350 on Thursday morning.
Bitcoin’s retreat happened as investors pulled funds from Bitcoin-related ETFs. Spot Bitcoin ETFs shed over $127 million on Tuesday, bringing the net inflows this year to $17.95 billion. Blackrock’s IBIT has maintained the lead as the biggest Bitcoin ETF with over $22 billion in assets.
Bitcoin also pulled back even after Nvidia published strong financial results. The company, which makes GPUs used for data centers, said that its revenue jumped by over 122% in Q2, pushing it to announce a $50 billion share repurchase program. Its revenue jumped to over $30 billion. It also boosted its Q3 revenue guidance to over $32.5 billion, signaling that there was still demand.
There will be no major BTC/USD news on Thursday. From a macro level, the US will publish the latest GDP and initial jobless claims data followed by the PCE inflation report on Friday. These are crucial numbers but their impact will be fairly mild since the Fed has already hinted that it will start cutting rates in September.
BTC/USD technical analysis
The BTC/USD pair made a strong bullish breakout last week after Powell pointed to a rate cut in September. It emerged from a range where it spent in the last three weeks and moved to the key resistance point at 64,995.
The pair then formed a small double-top pattern on the four-hour chart and then resumed the downtrend. It has now formed a small bearish flag chart pattern, which often leads to more downside.
Bitcoin has also formed a death cross as the 200-period and 50-period moving averages have crossed each other. The Relative Strength Index (RSI) has also continued moving downwards as the pair has moved to the 50% retracement point.
Therefore, the path of the least resistance is downwards, with the next point to watch being at 56,000, the lowest swing on August 15.
More By This Author:
GBP/USD Forex Signal: Sterling Surge Gains MomentumBTC/USD Forex Signal: Bitcoin Bulls Eye The Resistance At $68,000
GBP/USD Forex Signal: Bulls Need to Overcome Resistance At 1.3140
Disclosure: DailyForex will not be held liable for any loss or damage resulting from reliance on the information contained within this website including market news, analysis, trading signals ...
more


