BTC/USD Forex Signal: Loses Momentum As Megaphone Forms
Bullish view
- Sell the BTC/USD pair and set a take-profit at 108,000.
- Add a stop-loss at 115,000.
- Timeline: 1-2 days.
Bullish view
- Buy the BTC/USD pair and set a take-profit at 115,000.
- Add a stop-loss at 108,000.
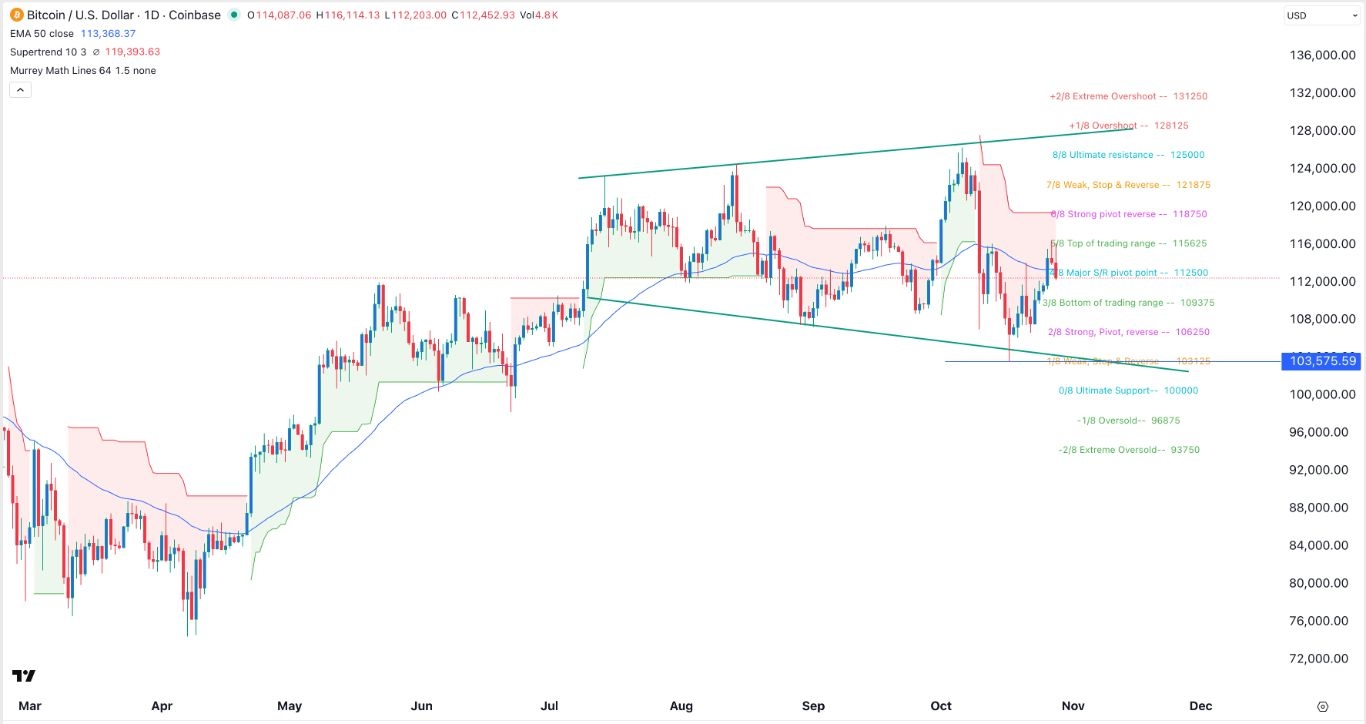
(Click on image to enlarge)

Bitcoin price gave up some of the recent gains, moving to a low of $112,800, down from this week’s high of $116,580. It has now dropped by 10.75% from its highest level this year.
Bitcoin dropped despite having some notable catalysts, including the rising ETF inflows and the potential for interest rate cuts by the Federal Reserve.
The BTC/USD pair also retreated even as American stocks continued their uptrend. The Dow Jones Index rose by 161 points, while the Nasdaq 100 and the S&P 500 Index rose by over 0.20% and 0.8%, respectively. These indices tend to have a close correlation with Bitcoin.
Bitcoin also declined amid more regulatory clarity in the US, where the Securities and Exchange Commission approved a few altcoin ETFs like those tracking Hedera, Litecoin, and Solana.
Looking ahead, Bitcoin price will react to the Federal Reserve interest rate decision, which will come out later today. If everything goes as expected, it will be the second consecutive month that the Fed has slashed interest rates.
Another important event will happen in South Korea where Donald Trump and Xi Jinping will have the first one-on-one discussion on trade and other issues. This talk aims to cool down pressures between the two countries, which will be a good thing for the crypto market.
The risk for Bitcoin, is that the Fed cut and Trump’s talks with Xi Jinping have all been priced in. As such, they may experience a sell-the-news situation.
Bitcoin and other coins will react mildly to the upcoming European Central Bank (ECB) and Bank of Japan (BoJ) interest rate decisions.
BTC/USD Technical Analysis
The daily timeframe chart shows that Bitcoin bottomed at $103,574 earlier this month and then bounced back reaching a high of 116,300. It has remained below the Supertrend indicator on the daily chart.
Bitcoin price has also dropped below the 50-day Exponential Moving Average (EMA). It also movd slightly below the Major S&R pivot point of the Murrey Math Lines tool.
Therefore, the coin will likely remain under pressure in the near term, potentially reaching a low of 108,000. On the positive side, it has formed a giant megaphone pattern, which may lead to more gains in the coming weeks.
More By This Author:
EUR/USD Forex Signal: Triangle Pattern Points To A Strong BreakoutTop 3 Dow Jones Index And DIA ETF Stocks To Watch This Week
AUD/USD Forex Signal: Megaphone Forms Ahead Of Australia CPI, Fed Decision
Risk Disclaimer: DailyForex will not be held liable for any loss or damage resulting from reliance on the information contained within this website including market news, analysis, trading signals ...
more


