BTC/USD Forex Signal: Is The Breakout Valid
Today’s BTC/USD Signals
(Click on image to enlarge)
Long Trade Idea
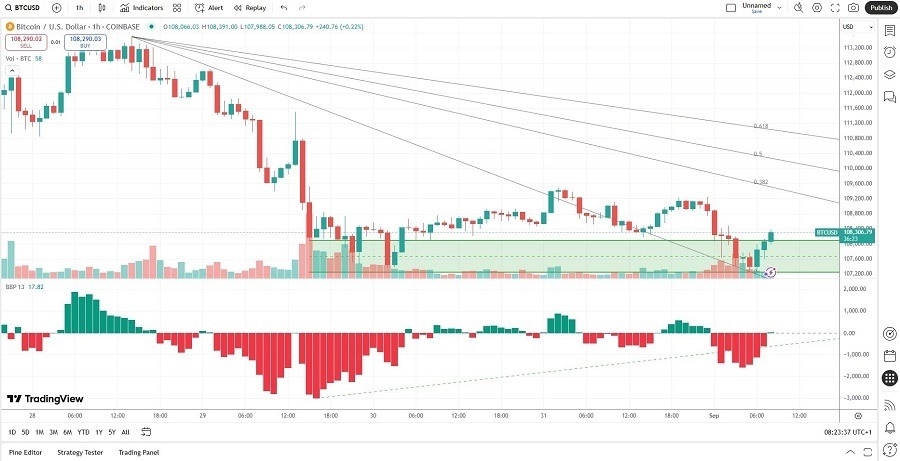
- Long entry between $107,250 and $108,089, the lower and upper bands of its horizontal support zone.
- Place your stop-loss level at $200 below your entry level.
- Adjust the stop-loss to break even once the trade is $500 in profit.
- Take off 50% of the position as profit when the price reaches $500 in profit and leave the remainder of the position to run.
Short Trade Idea
- Short entry if price action breaks down below $106,750, $500 below the lower band of its horizontal support zone.
- Place your stop-loss level $200 above your entry level.
- Adjust the stop-loss to break even once the trade is $500 in profit.
- Take off 50% of the position as profit when the price reaches $500 in profit and leave the remainder of the position to run.
The best method to identify a classic “price action reversal” is for an hourly candle to close, such as a pin bar, a doji, an outside, or even just an engulfing candle with a higher close. You can exploit these levels or zones by watching the price action that occurs at the given levels.
BTC/USD Fundamental Analysis
BTC/USD Technical Analysis
So, why am I bullish on BTC/USD after its earlier breakout?
Price action completed its post-all-time-high sell-off after dropping to 107,250. Price action quickly reversed and completed a breakout above its horizontal support zone, with rising volume. I see the descending 38.2% Fibonacci Retracement Fan as the next minor resistance level. A continuation of the breakout sequence is possible with $111,105, the intra-day high before a reversal, as the next target.
The Bull Bear Power Indicator has improved over the past five hours and has completed a bullish crossover. I believe it will strengthen further into the morning session and confirm the breakout.
Bullish momentum could accelerate as the breakout may result in a short-covering rally. It will wash out the latest short positions betting on a test of the psychological 100,000 support level. Crypto traders should get $500 to $750 from this long position, but it could magnify with a breakout above the 38.2% Fibonacci Retracement Fan.
(Click on image to enlarge)
Bitcoin/USD Price Chart
There is nothing of high importance scheduled today concerning either Bitcoin or the USD. It is a public holiday today in the USA.
More By This Author:
AUD/USD Forex Signal: Weak Bullish Consolidation Below $0.6550Weekly Forex Forecast – S&P 500 Index, Silver, Gold
Forex Today: S&P 500 Inches To New All-Time High
Risk Disclaimer: DailyForex will not be held liable for any loss or damage resulting from reliance on the information contained within this website including market news, analysis, trading signals ...
more


