BTC/USD Forex Signal: Hits Resistance Amid Mt. Gox Bitcoin Sale
Bearish view
- Sell the BTC/USD pair and set a take-profit at 60,000.
- Add a stop-loss at 66,000.
- Timeline: 1-2 days.
Bullish view
- Set a buy-stop at 66,500 and a take-profit at 68,000.
- Add a stop-loss at 64,000.
(Click on image to enlarge)
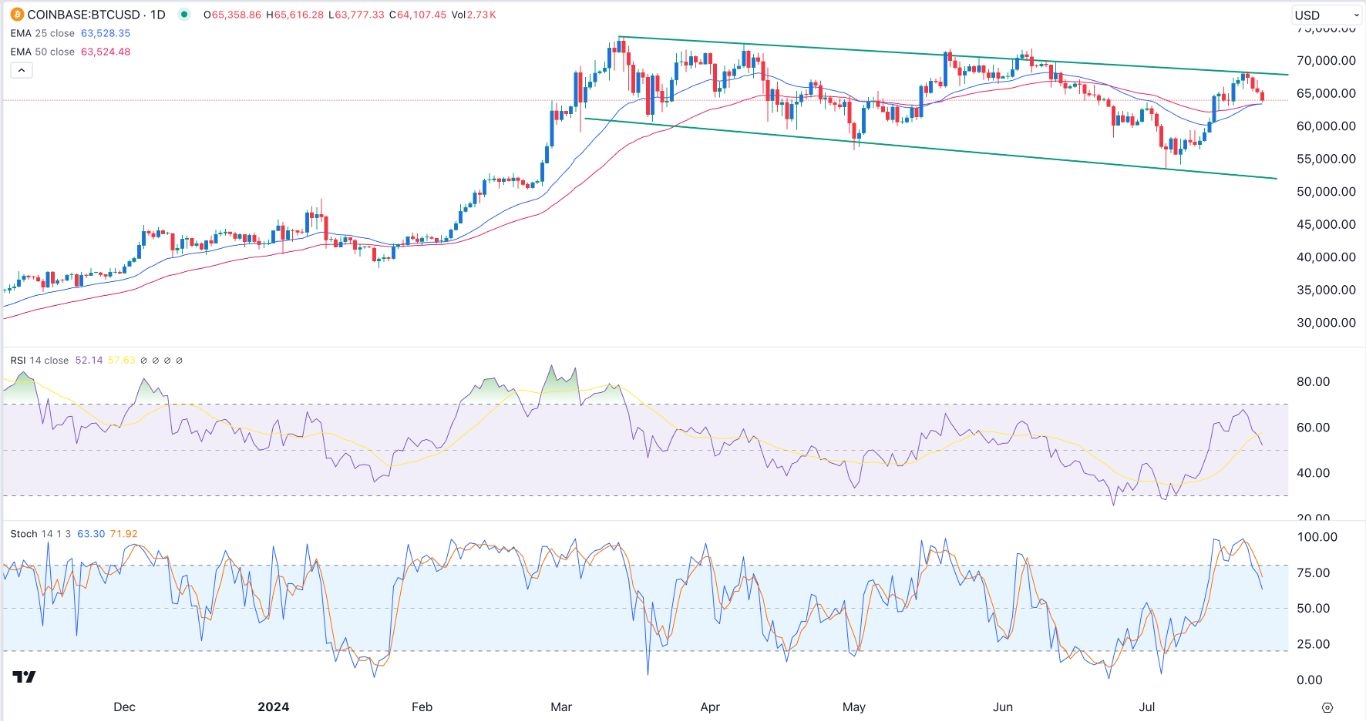
Bitcoin price faced strong resistance at $68,500 this week as investors focused on Mt.Gox account movements and US politics. The BTC/USD pair retreated to 64,000 as focus now moved to the upcoming US inflation data.
Mt.Gox Bitcoin movements
The crypto industry has had several important events this week. On Tuesday, nine new spot Ethereum Exchange Traded Funds (ETFs) started trading in a big victory for the cryptocurrency industry. These funds have attracted over $1 billion in assets and the trend is expected to continue growing.
The other big news was that spot Bitcoin ETFs continued to have inflows, mostly from institutional investors. Altogether, these funds have attracted over $17 billion in inflows this year, beating what analysts were expecting.
Meanwhile, there are signs that accounts associated with Mt. Gox have started moving money to repay customers. These accounts have over $8 billion and their movements will likely have an impact in the crypto industry.
Bitcoin also dropped as a sense of fear spread in the stock market after the weak corporate earnings. The Nasdaq 100 index crashed by over 615 points while the Dow Jones and S&P 500 indices fell by 430 and 120 points. Popular companies like Tesla and Google were among the worst performers.
Looking ahead, traders will focus on Friday’s Personal Consumption Expenditure (PCE) report. These are crucial numbers because of their impact on the Federal Reserve. The general view is that the PCE and core PCE dropped slightly in June, a move that will incentivise the Fed to start cutting interest rates as soon as in July. Bitcoin does well when the Fed is about to start cutting interest rates.
BTC/USD technical analysis
The 4H chart shows that the BTC/USD pair bounced back from this month’s low of 53,556 to a high of 68,500. It faced significant resistance at 68,500 and pulled back to 64,000 as the Mt. Gox liquidations continued.
The pair has moved between the 61.8% and 78.6% Fibonacci Retracement point. It has found support slightly above the 50-period Exponential Moving Average (EMA). The two lines of the MACD indicator have pointed downwards.
Therefore, the pair will likely continue falling if bears manage to push it below the 50-period moving average. If this happens, the next point to watch will be at 64,000.
More By This Author:
EUR/USD Forex Signal: Cup And Handle Pattern FormsGBP/USD Forex Signal: Rally Still Intact Despite the Pullback
BTC/USD Forex Signal: Bitcoin Is Extremely Bullish Above 68,453
Disclosure: DailyForex will not be held liable for any loss or damage resulting from reliance on the information contained within this website including market news, analysis, trading signals ...
more


