BTC/USD Forex Signal: Falling Broadening Wedge Points To More Upside
Bullish view
- Buy the BTC/USD pair and set a take-profit at 71,000.
- Add a stop-loss at 65,000.
- Timeline: 1-2 days.
Bearish view
- Set a sell-stop at 67,000 and a take-profit at 65,000.
- Add a stop-loss at 70,000.
Bitcoin price held steady above $67,000 on Tuesday morning as investors focused on the US political events. The BTC/USD pair was trading at 67,445, much higher than this month’s low of 53,490.
Bitcoin’s rally faded after Joe Biden announced that he would not compete in the upcoming general election. Most analysts believe that he will be replaced by Kamala Harris, the vice president. While her polls are down, there are chances that she will do better than Biden who’s poll numbers were down.
Donald Trump has emerged as a favorite candidate among crypto investors for his positive statements about the industry. He even has a crypto portfolio worth $10 million, according to Arkham. JD Vance, his vice president, also has been a supporter of the industry.
The key catalyst for Bitcoin and other cryptocurrencies this week will be the upcoming spot Ethereum ETF approval. These funds are expected to start trading as soon as on Wednesday, a move that will lead to more inflows in the crypto industry.
Bitcoin will also react to Friday’s personal consumption expenditure (PCE) report scheduled for Friday. This is an important data because of its impact on the Federal Reserve, which has signalled an openness to start cutting interest rates later this year. Bitcoin thrives when the Fed is dovish.
BTC/USD technical analysis
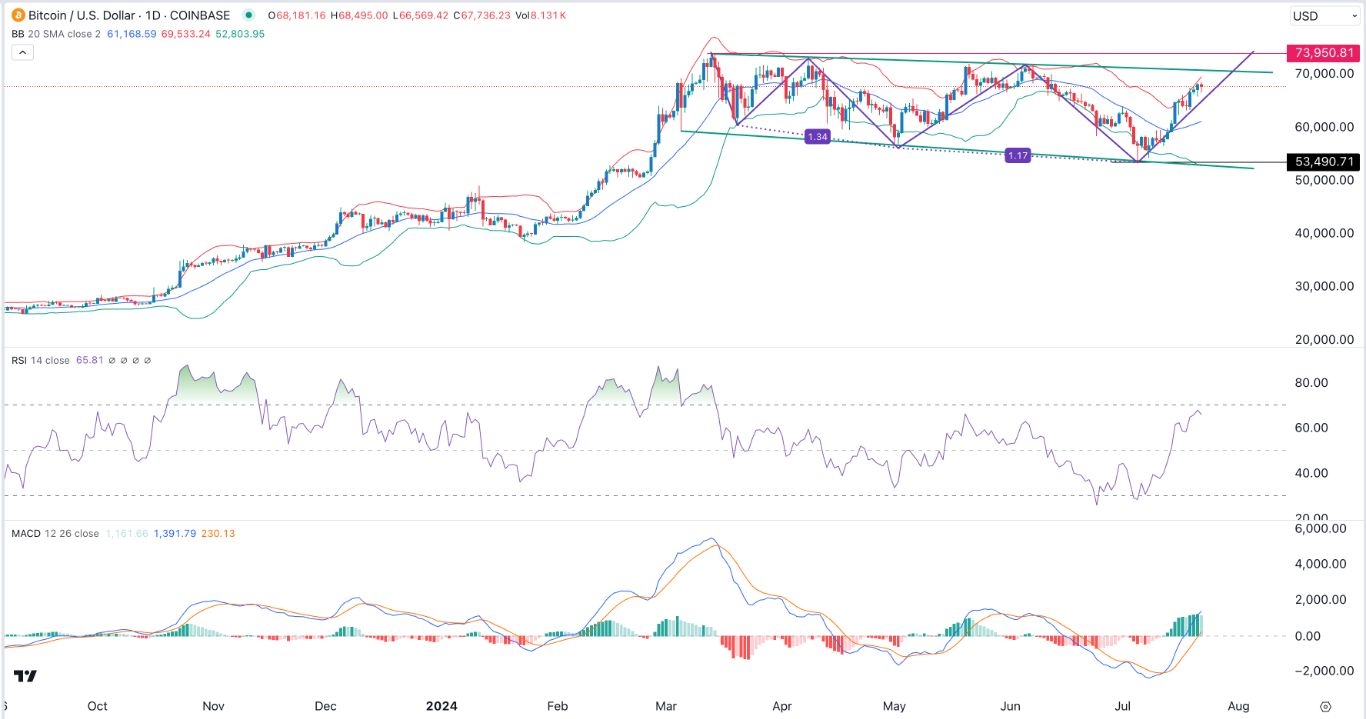
The daily chart shows that the price of Bitcoin has held steady in the past few weeks after forming a hammer candlestick pattern on July 5th. A hammer is one of the most popular reversal candlestick patterns.
It has formed a falling broadening wedge pattern, a popular bullish sign. The three drives pattern shows that the pair has moved in the third phase. The pair has moved to the upper side of the upper side of the Bollinger Bands.
It has moved above the 50-day moving average while the histogram of the MACD has moved above the neutral point. The Relative Strength Index (RSI) has continued rising and is nearing the overbought point of 70.
Therefore, the pair will likely continue rising as buyers target the key resistance point at 70,000. A break above that level will point to more upside as traders target the year-to-date high of 73,900.
More By This Author:
EUR/USD Forex Signal: Cup And Handle Points To A ReboundEUR/USD Weekly Forecast: Inverse H&S Pattern Points To A Rebound
EUR/USD Forex Signal: Path Of The Least Resistance Is Higher
Disclosure: DailyForex will not be held liable for any loss or damage resulting from reliance on the information contained within this website including market news, analysis, trading signals ...
more


