
BTC/USD Forex Signal: Extremely Bearish Outlook After The FOMC Decision
Bearish view
- Sell the BTC/USD pair and set a take-profit at 84,000.
- Add a stop-loss at 92,000.
- Timeline: 1-2 days.
Bullish view
- Buy the BTC/USD pair and set a take-profit at 92,000.
- Add a stop-loss at 84,000.
(Click on image to enlarge)
Bitcoin price continued its consolidation on Thursday after the Federal Reserve delivered its interest rate decision and as ETF outflows continues. The BTC/USD pair was trading at 89,000 on Thursday, inside a range it has been in the past few days.
Bitcoin price wavered after the Federal Reserve delivered its first interest rate decision of the year. The bank left the interest rate unchanged between 3.50% and 3.75%, with officials underscoring the resilience of the US economy.
Bitcoin reacted mildly to the Fed decision because it was in line with what most analysts were expecting. Also, Jerome Powell did not make any major announcement on the future of interest rates this year.
The BTC/USD pair also wavered after Donald Trump announced that he would attack Iran unless its leaders made a deal with the United States. Trump made the warning after an armada arrived in the Middle East.
A major war between the United States and Iran would have a major implications for Bitcoin and other altcoins. For example, Iran has vowed to respond by attacking US bases in the region and interfering with trade flows at the Strait of Hormuz. Such a move would lead to higher inflation in the US and make it hard for the Fed to cut rates.
Meanwhile, the spot Bitcoin ETF inflows remained under pressure, a sign of weak demand. These funds have had over $140 million outflows this week after shedding $1.3 billion in assets last week.
BTC/USD Technical Analysis
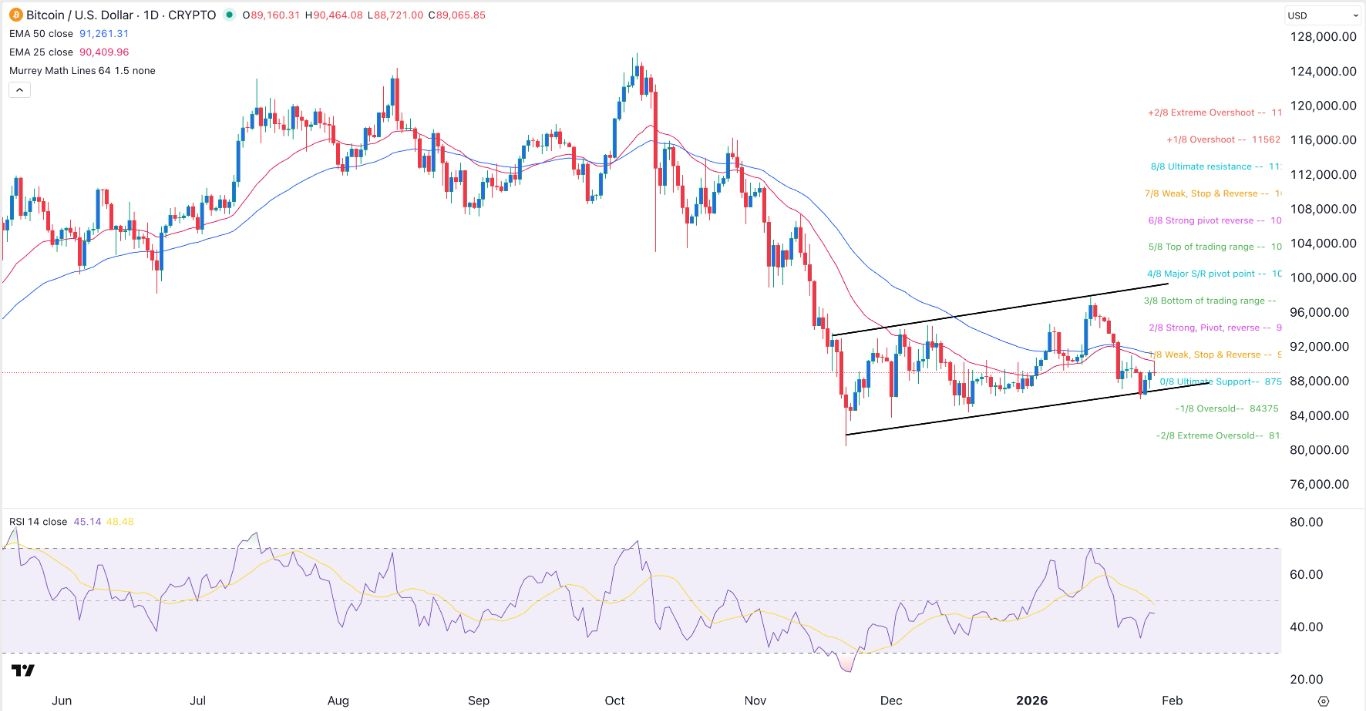
The daily timeframe chart shows that the BTC/USD pair has pulled back from a high of 98,000 to the current 89,000. It has moved below the 50-day and 100-day Exponential Moving Averages (EMA).
The pair has formed a bearish flag chart pattern, a popular bearish continuation sign in technical analysis. Also, the Relative Strength Index (RSI) has moved below 50.
The pair has moved to the ultimate support level of the Murrey Math Lines tool. Therefore, the pair will likely have a strong bearish breakdown, potentially to the November low of 80,400.
More By This Author:
BTC/USD Forex Signal: Bitcoin Price Eyes A Strong Bearish BreakoutBTC/USD Forex Signal: Bearish Flag Points To A Drop Ahead
GBP/USD Forex Signal: Gains Momentum Amid Potential Fed And BoE Divergence
Risk Disclaimer: DailyForex will not be held liable for any loss or damage resulting from reliance on the information contained within this website including market news, analysis, trading signals ...
more

