BTC/USD Forex Signal: Descending Channel Leading Price To Support Below $30k
My previous BTC/USD signal on 10th July was not triggered as there was no bearish price action when the resistance level at $30,605 was first reached that day.
Today’s BTC/USD Signals
Risk 0.50% per trade.
Trades may only be entered before 5 pm Tokyo time Thursday.
Long Trade Ideas
- Go long after a bullish price action reversal on the H1 timeframe following the next touch of $29,424 or $29,207.
- Put the stop loss of $100 below the local swing low.
- Move the stop loss to break even once the trade is $100 in profit by price.
- Take off 50% of the position as profit when the trade is $100 in profit by price and leave the remainder of the position to ride.
Short Trade Ideas
- Go short after a bearish price action reversal on the H1 timeframe following the next touch of $30,449 or $31,604.
- Put the stop loss of $100 above the local swing high.
- Move the stop loss to break even once the trade is $100 in profit by price.
- Take off 50% of the position as profit when the trade is $100 in profit by price and leave the remainder of the position to ride.
The best method to identify a classic “price action reversal” is for an hourly candle to close, such as a pin bar, a doji, an outside, or even just an engulfing candle with a higher close. You can exploit these levels or zones by watching the price action that occurs at the given levels.
BTC/USD Analysis
I wrote in my previous BTC/USD analysis on 10th July that we had a very pivotal area of resistance close above the $31k area but also very firm support just below the big round number at $30k. I was looking for a long trade from a bullish bounce at support.
My call was of no consequence, as the price did not get below $30k that day.
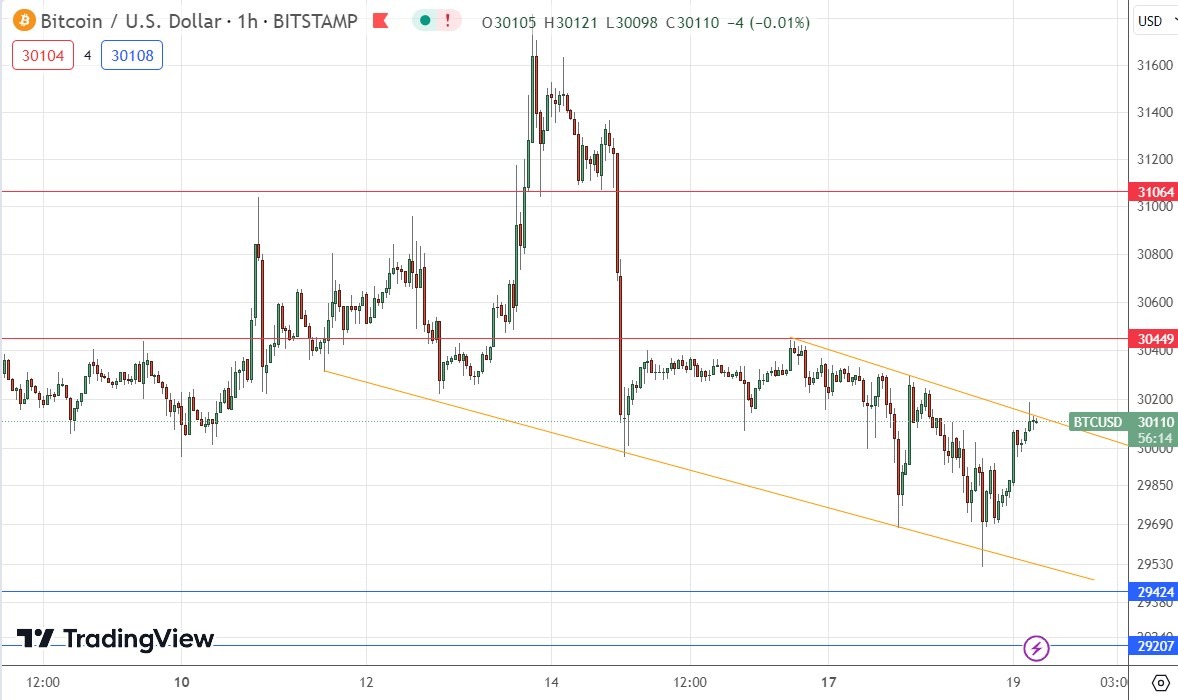
Since then, we have seen the $31k area continue to hold as firm resistance, but we have also seen the price continue to rebound from the supportive area below $30k. However, that area of support is starting to come into question as the price persists in moving down. Technically, this short-term downward price movement is supported by the descending trend line shown in the price chart below, which is arguably becoming a bearish channel. This is likely to continue to move the price down to the nearest support level of $29,424.
It is interesting that while US stocks are taking off, Bitcoin remains unable to break above $31k and stay there – stocks and Bitcoin usually show a positive correlation.
I am still ready to take a long trade today from a bullish bounce at $29,424. However, if the price gets established below that level, it could be very pivotal, and trigger a sharp fall.
(Click on image to enlarge)

More By This Author:
Weekly Forex Forecast - Sunday, July 16GBP/USD Weekly Forecast: July 17- 21
EUR/USD Technical Analysis: Confirming Bullish Trend
Disclosure: DailyForex will not be held liable for any loss or damage resulting from reliance on the information contained within this website including market news, analysis, trading signals ...
more


