BTC/USD Forex Signal: Consolidates As The Bond Sell-Off Intensifies
Bullish view
- Buy the BTC/USD pair and set a take-profit at 28,600.
- Add a stop-loss at 26,500.
- Timeline: 1 day.
Bearish view
- Set a sell-stop at 27,000 and a take-profit at 26,000.
- Add a stop-loss at 28,000.
Bitcoin, stocks, and American bonds retreated sharply in the overnight session as risks continued growing. The BTC/USD pair retreated to a low of 27,185, lower than this week’s high of 28,558. It remains almost 10% above the lowest level in September.
Bond sell-off continues
Bitcoin and other cryptocurrencies came under pressure as bets of higher rates continued after the strong US vacancies data. According to the Bureau of Labor Statistics (BLS), the JOLTs job openings jumped to more than 9.16 million in August, higher than the median estimate of 8.8 million.
The data came ahead of the upcoming ADP private sector jobs data by ADP. Economists polled by Reuters expect the data to show that the economy created over 160k jobs in September after adding 177k in the previous month.
The BLS will next publish the latest non-farm payrolls (NFP) data on Friday. These numbers will provide more information on what to expect from the Federal Reserve in the coming months.
Some Fed officials have pointed to the need for more rate hikes or leaving rates at the current level for a while. They cite the fact that inflation remains at an elevated level. The most recent data showed that the headline consumer price index (CPI) jumped to 3.7% in August. In a statement, Fed’s Loretta Mester said:
“At this point, I suspect we may well need to raise the fed funds rate once more this year and then hold it there for some time as we accumulate more information on economic developments.”
Bitcoin also retreated as the bond sell-off intensified. The 10-year yield jumped to 4.7% while the 30-year soared to 3.80%. Similarly, American stocks also plunged, with the Dow Jones and Nasdaq 100 falling by more than 500 and 200 points, respectively.
BTC/USD technical analysis
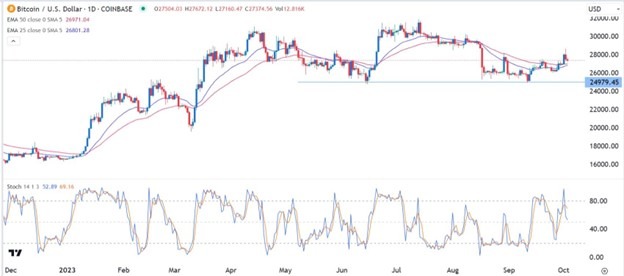
The BTC/USD pair has retreated in the past two straight days. On the daily chart, the pair remains slightly above the 25-day and 50-day moving averages. It has also formed a double-bottom pattern at 24,979 and an inverted head and shoulders. In price action analysis, these are some of the most bullish signs.
Therefore, the pair will likely remain in this range on Wednesday, with the key support and resistance to watch being 26,500 and 28,700. A move above this week’s high of 28,700 will point to more upside to 30,000.
(Click on image to enlarge)

More By This Author:
AUD/USD Forex Signal: Prediction As The US Dollar Index SurgesBTC/USD Forex Signal: Bullish View As Break And Retest Forms
GBP/USD Technical Analysis: Downward Trend Is Strong
Disclosure: DailyForex will not be held liable for any loss or damage resulting from reliance on the information contained within this website including market news, analysis, trading signals ...
more


