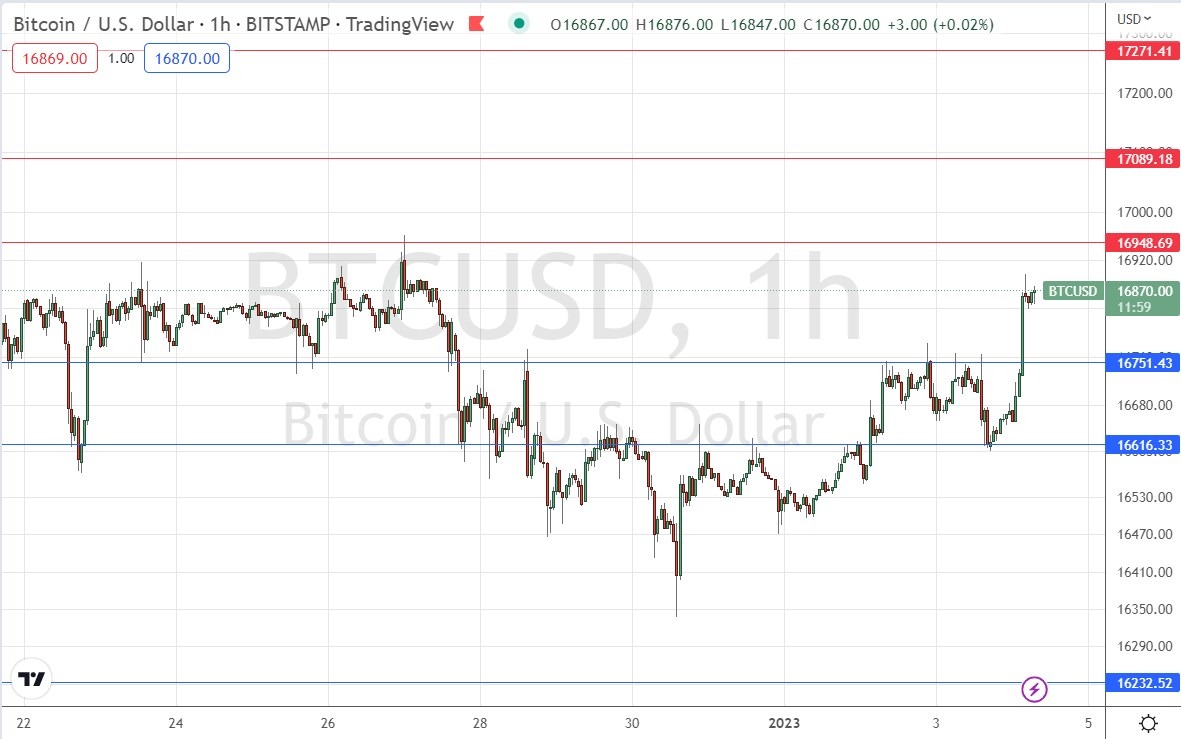
BTC/USD Forex Signal: Challenging Range Resistance At $16,949
Bitcoin has turned more bullish within its medium-term range as it prints new higher support levels.
Previous BTC/USD Signal
My previous Bitcoin signal on 28th December was not triggered as any of the key support and resistance levels identified were reached that day.
Today’s BTC/USD Signals
Risk 0.50% per trade.
Trades must be entered prior to 5 pm Tokyo time Thursday.
Long Trade Ideas
- Long entry after a bullish price action reversal on the H1 timeframe following the next touch of $16,751 or $16,616
- Place the stop loss $100 below the local swing low.
- Adjust the stop loss to break even once the trade is $100 in profit by price.
- Remove 50% of the position as profit when the trade is $100 in profit by price and leave the remainder of the position to run.
Short Trade Ideas
- Short entry after a bearish price action reversal on the H1 timeframe following the next touch of $16,949 or $17,089.
- Place the stop loss of $100 above the local swing high.
- Adjust the stop loss to break even once the trade is $100 in profit by price.
- Take off 50% of the position as profit when the trade is $100 in profit by price and leave the remainder of the position to run.
The best method to identify a classic “price action reversal” is for an hourly candle to close, such as a pin bar, a doji, an outside, or even just an engulfing candle with a higher close. You can exploit these levels or zones by watching the price action that occurs at the given levels.
BTC/USD Analysis
I wrote in my previous analysis on 28th December that the price of BTC/USD was likely to fall as low as the support level at $16,233 because we had both a valid long-term bearish trend and short-term bearish momentum that day.
This was a good call, as we did see lower prices over the course of that day.
The price has been trading within a range for several weeks now, bordered by the upper range limit resistance at $16,949 and the key support level at $16,232.
The technical picture has changed over the past two weeks, as instead of falling to reach $16,233 the price has stabilized and produced more bullish price action over the past few days, printing new higher key support levels, and rising to again look like threatening the key resistance level at $16,949.
I think the resistance at $16,949 is likely to be very pivotal because it has been respected for so long. As we have a long-term bearish trend in Bitcoin, a bearish rejection of that level, ideally combined with a simultaneous rejection of $17k, would likely be a powerful short-trade entry signal.
On the other hand, if the price can break up above $17k and get established there, that would be a technically significant bullish breakout and a more bullish sign.
Long trades from bounces at the two nearby support levels are also possibilities, but I see these as likely to be short-term trades and so these opportunities if they are set up should be treated accordingly.
(Click on image to enlarge)

Concerning the US Dollar, there will be releases of ISM Manufacturing PMI data and JOLTS Job Openings at 3 pm London time.
More By This Author:
EUR/USD Technical Analysis: Beginning of 2023 TradingGold Technical Analysis: Strong Gold, Weak Dollar - Monday, Jan. 2
WTI Crude Oil: Weekly Forecast January 2 - 7
Disclosure: DailyForex will not be held liable for any loss or damage resulting from reliance on the information contained within this website including market news, analysis, trading signals ...
more


