BTC/USD Forex Signal: Bullish Consolidation Near Long-Term High
If we get another strong bearish rejection of the $38k area, this could be a good short trade, but due to the high volatility that trade could be a nervous ride.
My previous BTC/USD signal on 15th November was not triggered as there was no bearish price action at the first touch of either of the identified resistance levels.
Today’s BTC/USD Signals
Risk 0.75% per trade.
Trades may only be taken prior to 5pm Tokyo time Friday.
Long Trade Ideas
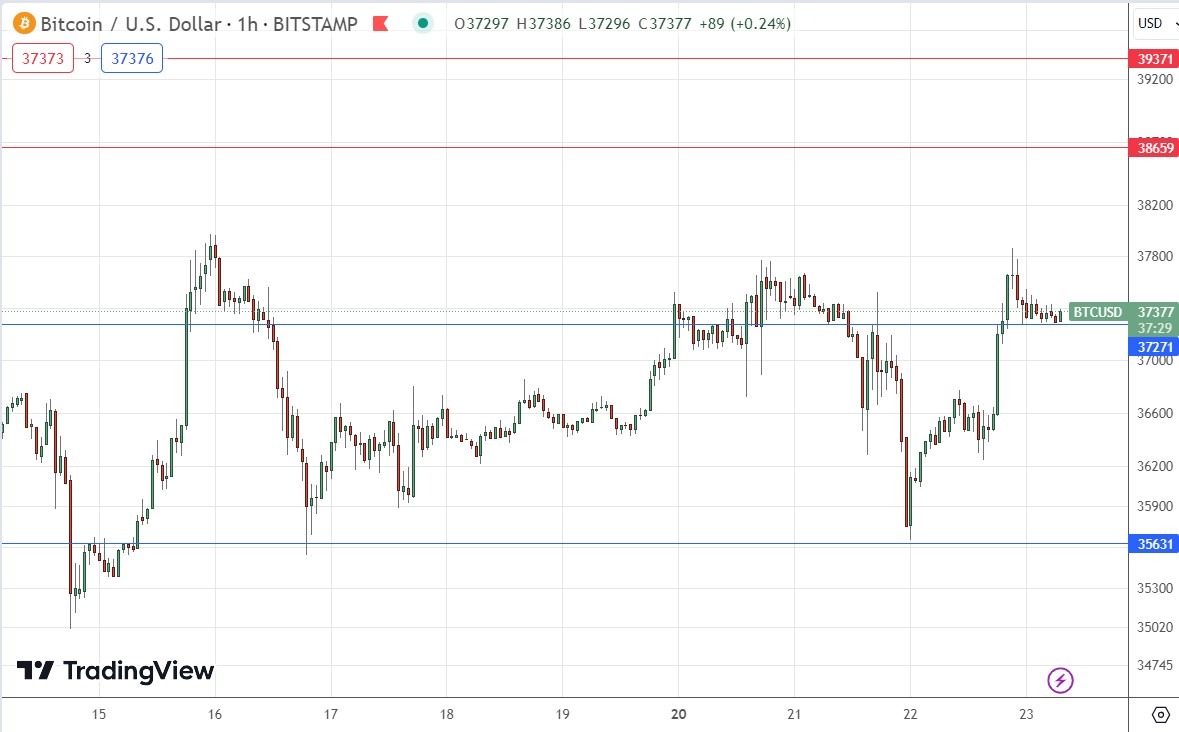
- Go long after a bullish price action reversal on the H1 timeframe following the next touch of $37,271 or $35,631.
- Put the stop loss $100 below the local swing low.
- Move the stop loss to break even once the trade is $100 in profit by price.
- Take off 50% of the position as profit when the trade is $100 in profit by price and leave the remainder of the position to ride.
Short Trade Ideas
- Go short after a bearish price action reversal on the H1 timeframe following the next touch of $38,659 or $39,371.
- Put the stop loss $100 above the local swing high.
- Move the stop loss to break even once the trade is $100 in profit by price.
- Take off 50% of the position as profit when the trade is $100 in profit by price and leave the remainder of the position to ride.
The best method to identify a classic “price action reversal” is for an hourly candle to close, such as a pin bar, a doji, an outside or even just an engulfing candle with a higher close. You can exploit these levels or zones by watching the price action that occurs at the given levels.
BTC/USD Analysis
I wrote in my previous BTC/USD analysis that as the price had been topping out at a long-term high, if the price remained below the resistance level at $35,902, I saw the day’s outlook as bearish. The price in fact quickly broke above that level and continued to rise strongly over most of the day, making a new long-term high just below $38k.
The price has continued to range below that recent high, making quite deep retracements which have printed railway tracks on the daily price chart. This suggests increasing volatility which tends to spell the end of a trend, and if correct, this would be a bearish sign.
It is clear the price is probably in a fairly pivotal area. I think the best thing to do here is to wait for the price to make another attempt to break to a new high price.
If we get a daily close above $38k I will see that as a good long entry signal, as will most trend traders.
If we get another strong bearish rejection of the $38k area, this could be a good short trade, but due to the high volatility that trade could be a nervous ride.
Swing traders who are feeling very confidently bullish might try a long entry from the bullish bounce at the support level of $37,271 which already seems to be setting up as we approach the London open.
(Click on image to enlarge)

More By This Author:
GBP/USD Forex Signal: Neutral Outlook With A Bullish Bias
United States Federal Reserve Minutes: Fed Will Proceed With Caution
GBP/USD Analysis: Waiting For Autumn Forecast Statement
Disclosure: DailyForex will not be held liable for any loss or damage resulting from reliance on the information contained within this website including market news, analysis, trading signals ...
more


