BTC/USD Forex Signal: Bitcoin’s Sell-Off Finds Support At $28,785
The BTC/USD pair jumped sharply in the first part of the year as demand for Bitcoin rose and the US dollar index (DXY) retreated.
Bearish view
- Sell the BTC/USD pair and set a take-profit at 28,000.
- Add a stop-loss at 29,500.
- Timeline: 1-2 days.
Bullish view
- Set a buy-stop at 29,200 and a take-profit at 30,200.
- Add a stop-loss at 28,200.
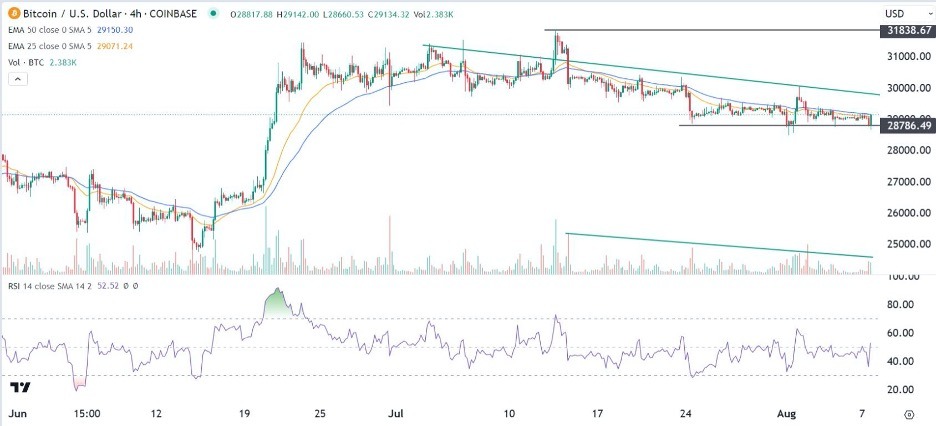
The BTC/USD pair was flat on Tuesday even as American equities bounced back. Bitcoin was trading at $29,000, a few points above last week’s low of $28,780. It has remained in this range in the past few weeks.
US stocks rebounded
Bitcoin price remained in a tight range even as American stocks bounced back. The Dow Jones index jumped by more than 400 points while the S&P 500 and Nasdaq 100 indices jumped by over 35 and 51 points, respectively.
This rebound followed a weekly decline after Fitch downgraded the US credit rating from AAA to AA+. Fitch cited the country’s rising debt and the growing budget deficit. Therefore, stocks rose as investors downplayed the impact of the downgrade to the US economy.
The BTC/USD pair also ignored the decision by PayPal to launch a stablecoin known as PYUSD. The stablecoin will be backed by the US dollar on a 1:1 basis, meaning it will compete with well-known stablecoins like Tether and USD Coin.
PayPal is seeking another revenue source as its business growth decelerates. Stablecoin issuers make money by investing these funds in safe assets like government and corporate bonds. They have become more profitable as interest rates rise.
In the past, Bitcoin and other cryptocurrencies used to jump when a big company like PayPal made such an announcement.
BTC/USD technical analysis
The BTC/USD pair jumped sharply in the first part of the year as demand for Bitcoin rose and the US dollar index (DXY) retreated. Bitcoin rose to a high of $31,838 in June. Since then, the pair has moved sideways and moved slightly below the 25-period and 50-period moving averages.
The BTC/USD pair has moved below the descending trendline that connects the highest point on July 3rd, July 23rd, and August 2nd. Bitcoin has also found a strong support level at $28,786, where it failed to move below since July 24th.
At the same time, the Relative Strength Index (RSI) and other oscillators remained in a neutral point. Volume has also been falling. Therefore, Bitcoin will likely remain in this area on Tuesday. The key support and resistance levels to watch will be at 28,000 and 30,000.
(Click on image to enlarge)

More By This Author:
EUR/USD Technical Analysis: The Bearish Trend Is Still ValidUSD/CAD: Advance Upwards Challenging Values Seen Early June
EUR/USD Technical Analysis: Expectations Of Relatively Quiet Movements
Disclosure: DailyForex will not be held liable for any loss or damage resulting from reliance on the information contained within this website including market news, analysis, trading signals ...
more


