BTC/USD Forex Signal: Bitcoin Under Intense Pressure
Bearish view
- Sell the BTC/USD pair and set a take-profit at 55,000.
- Add a stop-loss at 62,000.
- Timeline: 1-2 days.
Bullish view
- Set a buy-stop at 61,000 and a take-profit at 63,000.
- Add a stop-loss at 57,000.
(Click on image to enlarge)
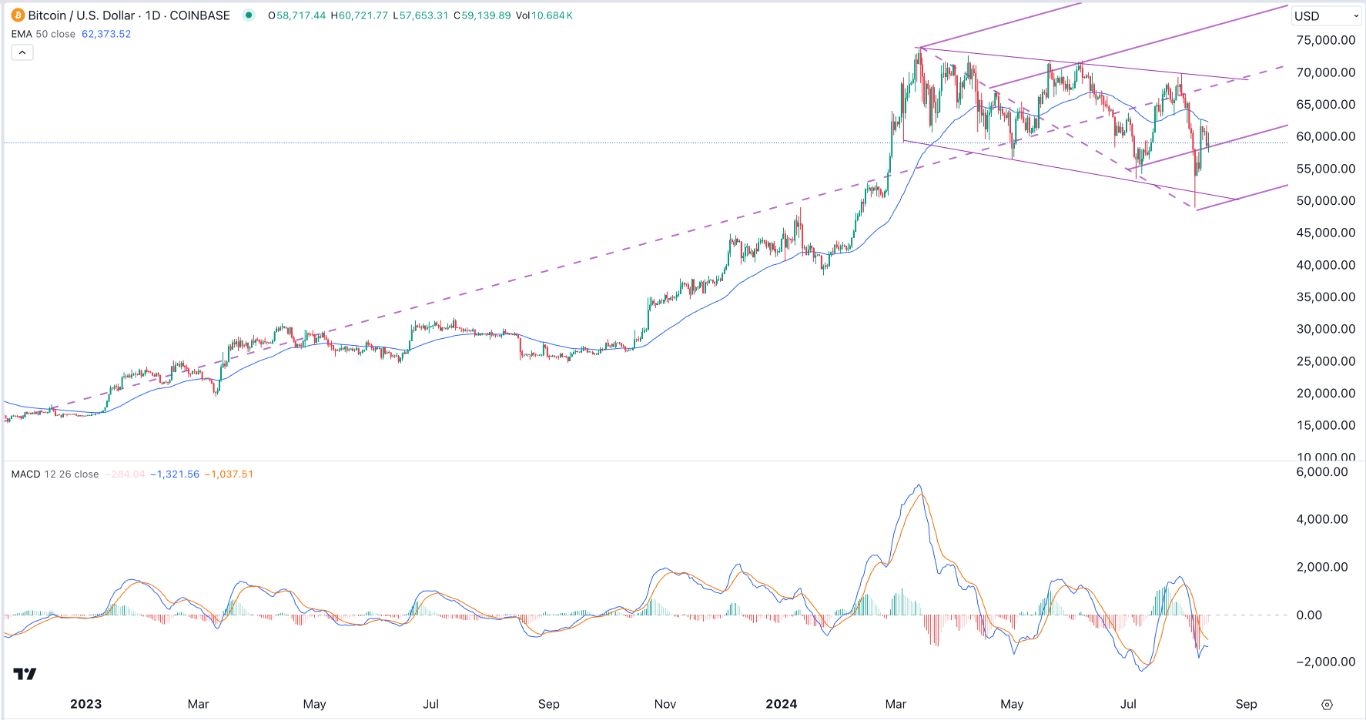
Bitcoin retreated slightly as traders waited for important economic numbers from the United States. The BTC/USD pair was trading at 59,115 on Tuesday morning, a few points below last week’s high of almost 63,000.
Key US economic data
Bitcoin and other financial assets are waiting for the upcoming US economic data that will set the tone for the upcoming Jackson Hole Symposium.
The US will release the important inflation data on Tuesday and Wednesday. The first report will be its producer price index, which, while important, will have a limited impact on financial assets.
Instead, traders will focus on the country’s consumer price index (CPI) set for Wednesday. These numbers will confirm whether the country’s inflation is falling as it has done in the past three straight months.
Inflation numbers are important for Bitcoin and other assets because of the impact on monetary policy. Together with the labor market, inflation forms part of the Fed’s dual mandate.
The other important data that could impact Bitcoin and other assets will be the country’s retail sales, manufacturing, and industrial production report.
Bitcoin also reacted mildly to an interview between Donald Trump and Elon Musk. In it, Trump reiterated his support for cryptocurrencies. In a recent statement, Trump noted that his government will maintain its 213k Bitcoin holdings.
However, there are risks that Trump could lose the election as polls show that Kamala Harris has a higher chance. Still, historically, Bitcoin has done well under presidents of both parties. It rose to a record high during Obama, Trump, and Joe Biden.
BTC/USD technical analysis
The BTC/USD pair retreated as the recent bullish momentum faded. On the daily chart, it moved below the key support at 60,000. It has also moved below the first support of the Andrew’s pitchfork tool.
Bitcoin has also fallen below the 50-day Exponential Moving Average (EMA) while the MACD indicator has dropped below the neutral point. Therefore, the path of the least resistance for the pair is bearish, with the next level to watch being at 55,000. On the flip side, a move above the resistance at 62,000 will open the possibility of it rising to 65,000 in the coming weeks.
More By This Author:
AUD/USD Forex Signal: Inverse Head and Shoulders FormsGBP/USD Forex Signal: Bearish Flag Pattern Points To More Sell-Off
BTC/USD Forex Signal: Death Cross Meets Falling Wedge
Disclosure: DailyForex will not be held liable for any loss or damage resulting from reliance on the information contained within this website including market news, analysis, trading signals ...
more


