BTC/USD Forex Signal: Bitcoin Takes A Hit As Momentum Ends
Bullish view
- Buy the BTC/USD pair and set a take-profit at 58,000.
- Add a stop-loss at 49,500.
- Timeline: 1-2 days.
Bearish view
- Sell the BTC/USD pair and set a take-profit at 49,500.
- Add a stop-loss at 58,000.
(Click on image to enlarge)
Bitcoin and other cryptocurrencies continued their downward trend as a sense of fear continued in the crypto industry. The BTC/USD pair has now dropped in the past four straight days and is hovering at its lowest point since February.
Bitcoin’s crash coincided with the sell-off among other risky assets. On Monday, Japan’s top indices like the Nikkei 225 and the Topix crashed by over 10%, in their worst day in years. The same trend continued in the US where the Dow Jones fell by more than 1,000 points.
Crypto-related stocks also continued falling, with Coinbase retreating by over 8% and MicroStrategy declining by almost 10%. Mining stocks like Riot Platforms and Marathon Digital slumped as well.
The main drivers for the sell-off was the Bank of Japan’s rate hike and the weak US economic numbers. The decision by the BoJ to hike rates at a time when other central banks are cutting means that traders are now unwinding their yen carry trades,
Meanwhile, the weak US jobs numbers mean that the economy could be moving into a recession. While recessions are bad, in theory, they are usually good for stocks as they lead to more rate cuts and even quantitative easing.
After falling initially in 2020 at the onset of the COVID-19 pandemic, cryptocurrencies soared as the Fed slashed rates and started implementing quantitative easing policies. The same happened after the Global Financial Crisis of 2009.
Bitcoin also dropped as investors sold their BTC assets. Bitcoin and Ether ETFs had over $400 million and $300 million in outflows on Monday.
BTC/USD technical analysis
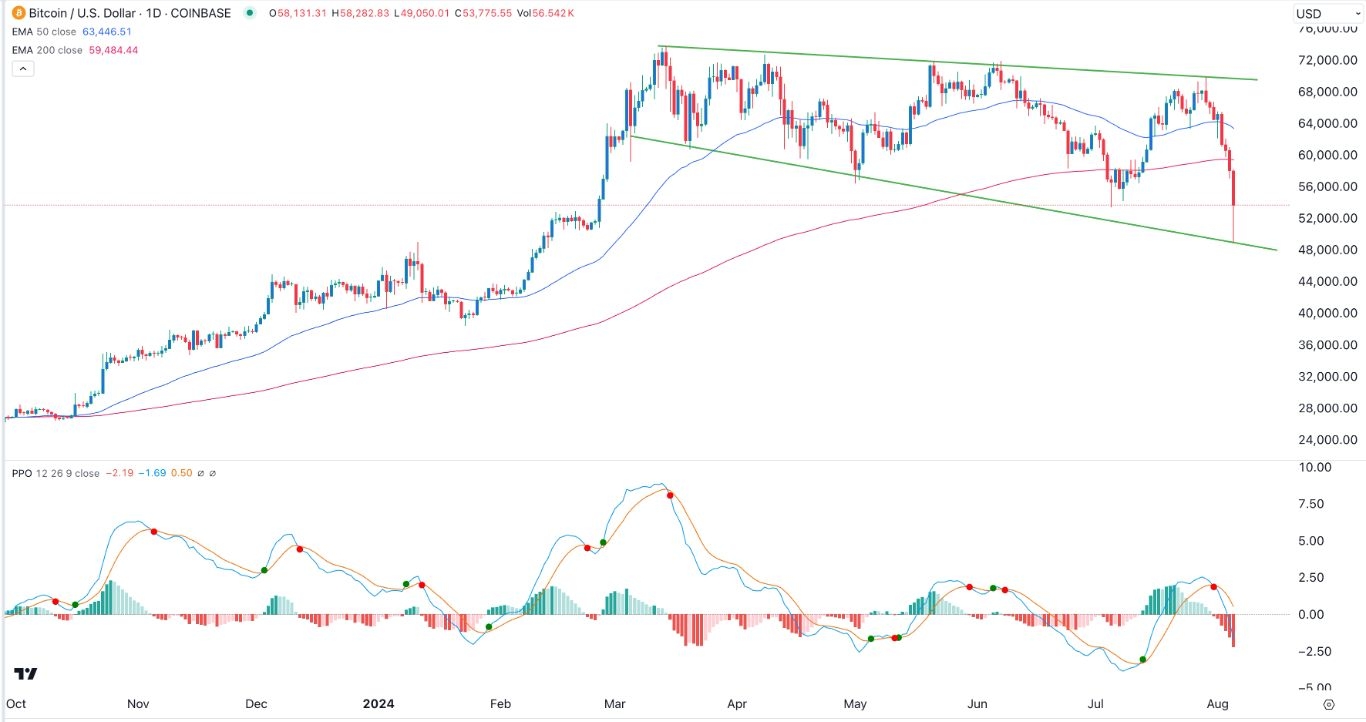
Bitcoin has been in a strong sell-off in the past few days. After peaking at $70,000 last week, the coin tumbled to a low of $49,200 on Monday. It has retreated below the 50-day and 200-day moving averages.
Bitcoin dropped and retested the lower side of the bullish broadening wedge chart pattern. In most cases, this pattern usually leads to more upsides.
Therefore, the BTC pair will likely attempt to bounce back as some investors buy the dip. If this happens, it could rise to as high as 58,000. However, a drop below Monday’s low of 49,200 will point to more downside.
More By This Author:
BTC/USD Forex Signal: Path Of Least Resistance Is DownwardsEUR/USD Forex Signal: Symmetrical Triangle Forms Ahead Of FOMC
BTC/USD Forex Signal: Inverse Head And Shoulders Forms
Disclosure: DailyForex will not be held liable for any loss or damage resulting from reliance on the information contained within this website including market news, analysis, trading signals ...
more


