BTC/USD Forex Signal: Bitcoin Rally Has More Room To Run
Bullish view
- Buy the BTC/USD pair and set a take-profit at 72,000.
- Add a stop-loss at 64,000.
- Timeline: 1-2 days.
Bearish view
- Sell the BTC/USD pair and set a take-profit at 64,000.
- Add a stop-loss at 72,000.
(Click on image to enlarge)
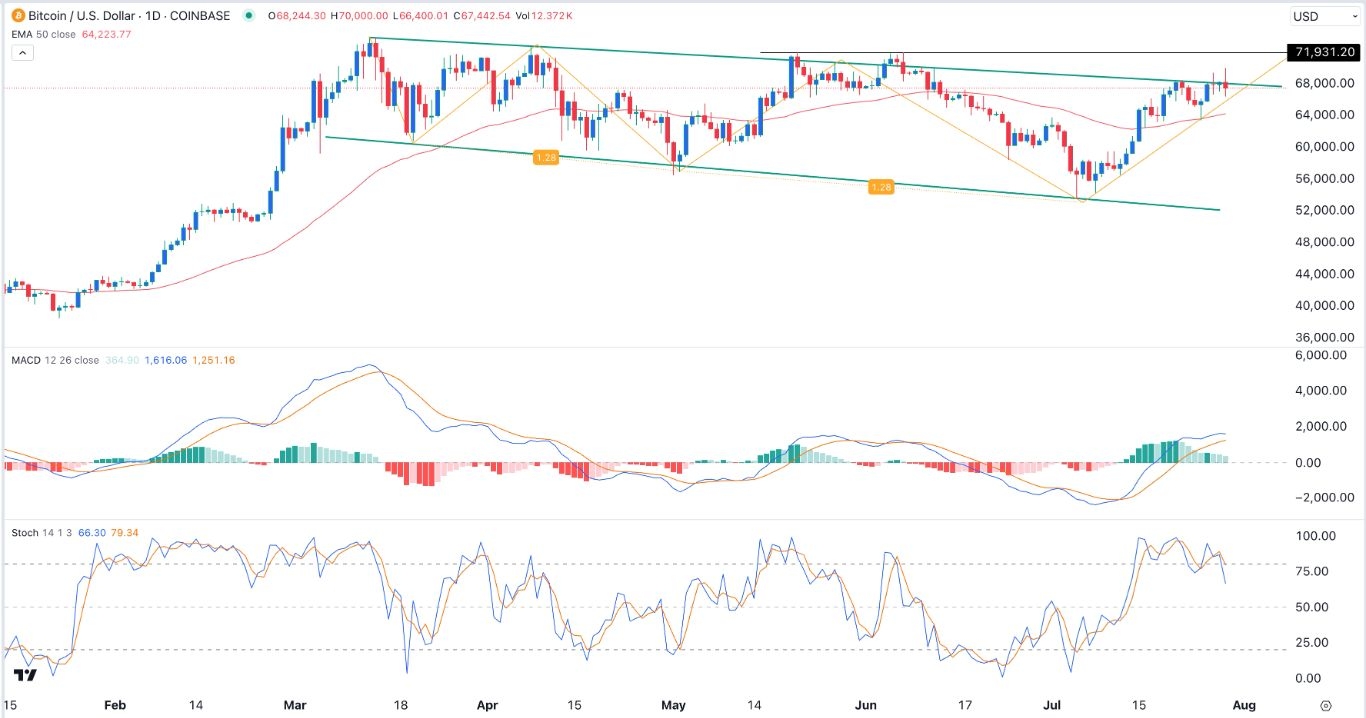
Bitcoin price made a brief bullish breakout on Monday and then retreated as the US started moving Silk Road coins. The BTC/USD pair was trading at 67,400 on Tuesday, down from this week’s high of 70,000.
Bitcoin is facing numerous catalysts as it continues going mainstream. On Saturday, Donald Trump, a former crypto critic, made another endorsement for the coin. Speaking at a crypto conference, he said that his administration would embrace Bitcoin and that he was open to creating a reserve.
The US is already one of the biggest companies in the Bitcoin industry, thanks to the vast amounts it has seized in the past few years. It has over 200,000 coins in its portfolio. Like Germany, it could decide to sell these coins or move them to the Treasury Department.
The government moved $2 billion worth of coins to an unlabeled address. It is unclear whether the US wants to sell some of these coins or whether it was simply moving them to an institutional custodian. Still, Bitcoin can absorb these movements or sales as it did with the German sales.
Looking ahead, the next key BTC/USD news will be the upcoming earnings by top companies in the industry like MicroStrategy, Riot Platforms, Coinbase, and Marathon Digital.
Bitcoin will also be impacted by the upcoming US consumer confidence report on Tuesday and Wednesday’s Federal Reserve decision. Bitcoin and other risky assets thrive when the Federal Reserve is dovish.
BTC/USD technical analysis
Bitcoin price rose briefly to the key resistance point at $70,000 and then retreated as some investors started to take profits. It has remained at the upper side of the descending trendline shown in green. This is an important line because it is the upper side of the falling broadening wedge chart pattern.
The pair has remained above the 50-day moving average while the MACD indicator stands above the neutral point. Also, the Stochastic Oscillator has pointed downwards. Therefore, the BTC/USD pair will likely continue rising as buyers target the important resistance point at 71,930.
The alternative scenario is where the pair retreats and retests the 50-day moving average point at 64,000.
More By This Author:
EUR/USD Forex Signal: Bearish Breakout Likely Ahead Of Fed DecisionGBP/USD Forex Signal: Volatility Ahead Of Fed And BoE Decisions
GBP/USD Forex Signal: Bearish Outlook Ahead of PCE Data
Disclosure: DailyForex will not be held liable for any loss or damage resulting from reliance on the information contained within this website including market news, analysis, trading signals ...
more


